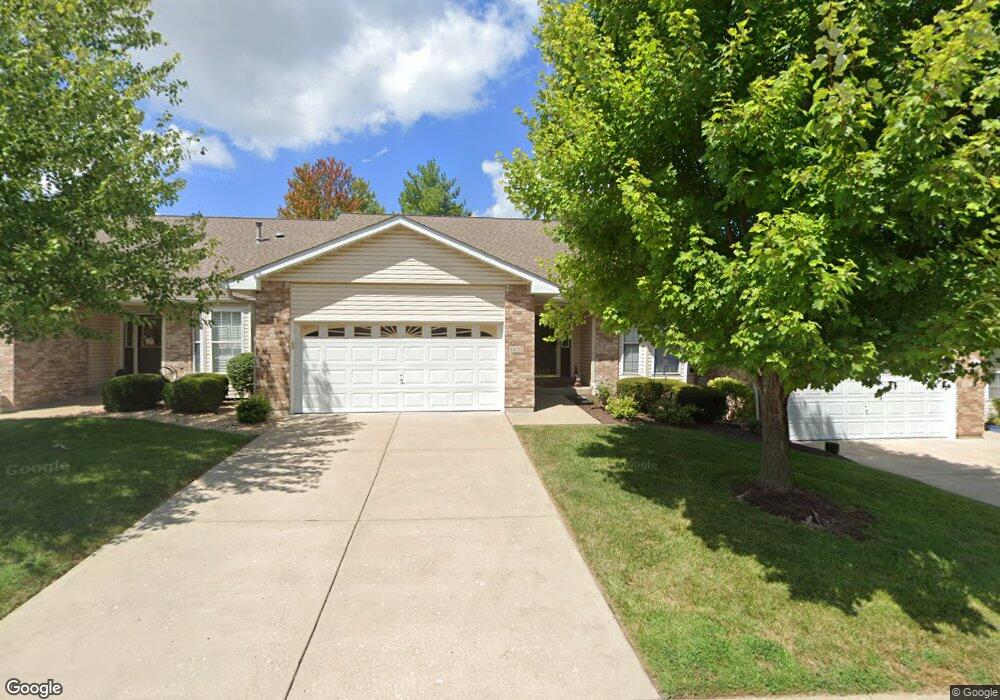
3435 Truman Terrace Dr Saint Charles, MO 63301
Old Town Saint Charles NeighborhoodEstimated Value: $299,000 - $347,000
2
Beds
2
Baths
1,472
Sq Ft
$215/Sq Ft
Est. Value
About This Home
This home is located at 3435 Truman Terrace Dr, Saint Charles, MO 63301 and is currently estimated at $316,159, approximately $214 per square foot. 3435 Truman Terrace Dr is a home located in St. Charles County with nearby schools including Harris Elementary School, Jefferson Intermediate School, and Hardin Middle School.
Ownership History
Date
Name
Owned For
Owner Type
Purchase Details
Closed on
Aug 18, 2023
Sold by
Stoll Rose Mary
Bought by
Defriese Mary M
Current Estimated Value
Home Financials for this Owner
Home Financials are based on the most recent Mortgage that was taken out on this home.
Original Mortgage
$261,250
Outstanding Balance
$255,461
Interest Rate
6.96%
Mortgage Type
New Conventional
Estimated Equity
$60,698
Purchase Details
Closed on
Feb 14, 2023
Sold by
St Charles-Noah Development Llc
Bought by
Plaza At Noahs Ark Community Improvement Dist
Purchase Details
Closed on
May 4, 2006
Sold by
Rothermich Robert E and Stevenson Carolyn
Bought by
Stoll John E and Stoll Rose Mary
Purchase Details
Closed on
May 20, 2002
Sold by
Rothermich Earl C and Rothermich Agnes M
Bought by
Agnes M Rothermich Trust Agreement
Purchase Details
Closed on
Apr 12, 2001
Sold by
Greater Missouri Builders Inc
Bought by
Rothermich Earl C and Rothermich Agnes M
Create a Home Valuation Report for This Property
The Home Valuation Report is an in-depth analysis detailing your home's value as well as a comparison with similar homes in the area
Home Values in the Area
Average Home Value in this Area
Purchase History
| Date | Buyer | Sale Price | Title Company |
|---|---|---|---|
| Defriese Mary M | -- | None Listed On Document | |
| Plaza At Noahs Ark Community Improvement Dist | -- | None Listed On Document | |
| Stoll John E | $200,000 | Ust | |
| Agnes M Rothermich Trust Agreement | -- | -- | |
| Rothermich Earl C | -- | -- |
Source: Public Records
Mortgage History
| Date | Status | Borrower | Loan Amount |
|---|---|---|---|
| Open | Defriese Mary M | $261,250 |
Source: Public Records
Tax History Compared to Growth
Tax History
| Year | Tax Paid | Tax Assessment Tax Assessment Total Assessment is a certain percentage of the fair market value that is determined by local assessors to be the total taxable value of land and additions on the property. | Land | Improvement |
|---|---|---|---|---|
| 2025 | $3,153 | $54,423 | -- | -- |
| 2023 | $3,148 | $49,107 | $0 | $0 |
| 2022 | $2,772 | $40,294 | $0 | $0 |
| 2021 | $2,775 | $40,294 | $0 | $0 |
| 2020 | $2,792 | $38,964 | $0 | $0 |
| 2019 | $2,767 | $38,964 | $0 | $0 |
| 2018 | $2,631 | $35,209 | $0 | $0 |
| 2017 | $2,595 | $35,209 | $0 | $0 |
| 2016 | $2,375 | $31,016 | $0 | $0 |
| 2015 | $2,371 | $31,016 | $0 | $0 |
| 2014 | $2,421 | $31,263 | $0 | $0 |
Source: Public Records
Map
Nearby Homes
- 2777 Ehlmann Rd
- 8 Wilton Ct
- 3509 Sutton Dr
- 3465 Sutton Ct
- 6 Wolverton Ct
- 3556 Compton Pkwy
- 622 Walnut Woods St
- 2934 Maldon Ln
- 2925 Nantwich Ln
- 3420 Ipswich Ln
- 2905 Maldon Ln
- 2976 Treemont Dr Unit 11B
- 932 Sugar Pear St
- 3335 Ipswich Ln
- 440 Benton Dr Unit L
- 450 Benton Dr Unit E
- 470 Benton Dr Unit E
- 480 Benton Dr Unit L
- 420 Benton Dr Unit C
- 420 Benton Dr Unit D
- 3435 Truman Terrace Dr Unit 3
- 3433 Truman Terrace Dr
- 3437 Truman Terrace Dr
- 3437 Truman Terrace Dr Unit 4
- 3431 Truman Terrace Dr
- 3441 Truman Terrace Dr
- 3441 Truman Terrace Dr Unit 5
- 3434 Truman Terrace Dr
- 3436 Truman Terrace Dr Unit 91
- 3436 Truman Terrace Dr
- 3438 Truman Terrace Dr
- 3443 Truman Terrace Dr
- 3442 Truman Terrace Dr
- 3442 Truman Terrace Dr Unit 89
- 3445 Truman Terrace Dr
- 3444 Truman Terrace Dr
- 6 Foxfield Ct
- 8 Foxbend Ct
- 3449 Truman Terrace Dr
- 3571 Truman Terrace Dr