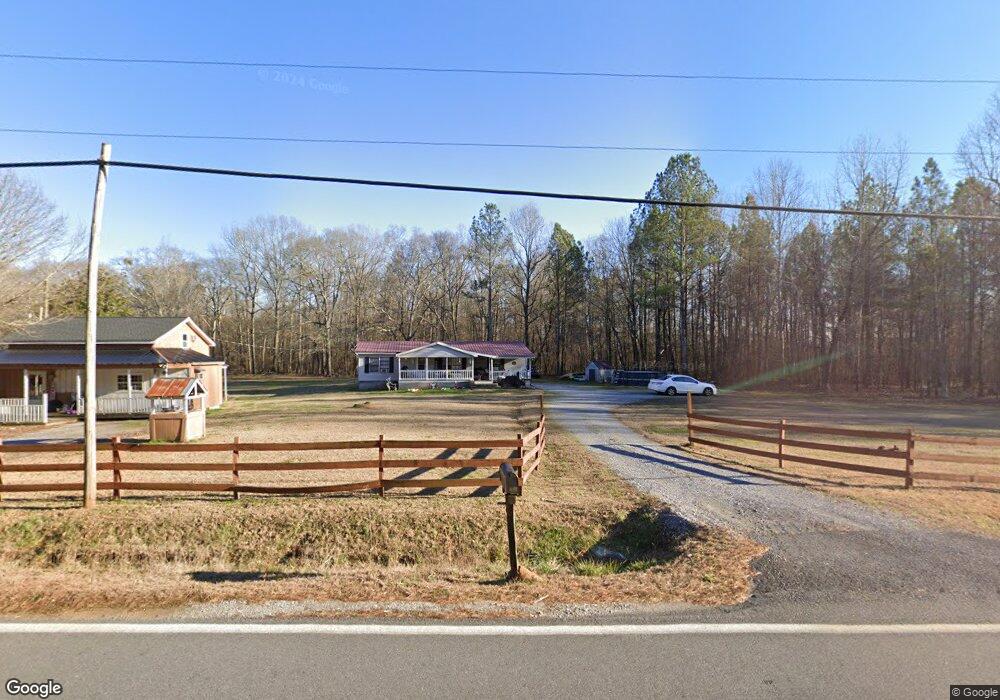
3436 Floyd Springs Rd NE Armuchee, GA 30105
Estimated Value: $296,000 - $422,000
--
Bed
--
Bath
1,732
Sq Ft
$203/Sq Ft
Est. Value
About This Home
This home is located at 3436 Floyd Springs Rd NE, Armuchee, GA 30105 and is currently estimated at $351,297, approximately $202 per square foot. 3436 Floyd Springs Rd NE is a home located in Floyd County with nearby schools including Bloomingdale Elementary School, Armuchee Middle School, and Armuchee High School.
Ownership History
Date
Name
Owned For
Owner Type
Purchase Details
Closed on
Mar 10, 2006
Sold by
Not Provided
Bought by
Long Allison K and Lambert Stacy K
Current Estimated Value
Purchase Details
Closed on
Jul 6, 1994
Sold by
Starnes Wm D and Millie Starnes Sirmans
Bought by
Lambert Doyal Blakley and Stacy Lynn
Purchase Details
Closed on
Nov 20, 1971
Sold by
Starnes Richard L
Bought by
Starnes William D and Millie Starnes
Purchase Details
Closed on
Jun 17, 1971
Bought by
P and R
Purchase Details
Closed on
Jan 9, 1965
Sold by
Starnes Richard L
Bought by
Starnes Richard L
Purchase Details
Closed on
Dec 8, 1964
Sold by
Pierce Robert
Bought by
Harris Jackson B
Purchase Details
Closed on
Nov 24, 1945
Sold by
Walraven D B
Bought by
Pierce Robert
Purchase Details
Closed on
Jan 1, 1945
Bought by
Walraven D B
Create a Home Valuation Report for This Property
The Home Valuation Report is an in-depth analysis detailing your home's value as well as a comparison with similar homes in the area
Home Values in the Area
Average Home Value in this Area
Purchase History
| Date | Buyer | Sale Price | Title Company |
|---|---|---|---|
| Long Allison K | -- | -- | |
| Lambert Doyal Blakley | $24,500 | -- | |
| Starnes William D | -- | -- | |
| P | -- | -- | |
| Starnes Richard L | $3,300 | -- | |
| Starnes Richard L | $300 | -- | |
| Harris Jackson B | -- | -- | |
| Pierce Robert | -- | -- | |
| Walraven D B | -- | -- |
Source: Public Records
Tax History Compared to Growth
Tax History
| Year | Tax Paid | Tax Assessment Tax Assessment Total Assessment is a certain percentage of the fair market value that is determined by local assessors to be the total taxable value of land and additions on the property. | Land | Improvement |
|---|---|---|---|---|
| 2024 | $2,562 | $116,481 | $25,282 | $91,199 |
| 2023 | $1,987 | $111,857 | $22,984 | $88,873 |
| 2022 | $2,188 | $92,302 | $18,894 | $73,408 |
| 2021 | $1,915 | $76,128 | $17,056 | $59,072 |
| 2020 | $1,825 | $71,370 | $14,832 | $56,538 |
| 2019 | $1,680 | $64,482 | $14,832 | $49,650 |
| 2018 | $1,624 | $61,454 | $14,127 | $47,327 |
| 2017 | $1,578 | $59,141 | $13,081 | $46,060 |
| 2016 | $1,489 | $53,316 | $13,080 | $40,236 |
| 2015 | $1,459 | $53,316 | $13,080 | $40,236 |
| 2014 | $1,459 | $53,316 | $13,080 | $40,236 |
Source: Public Records
Map
Nearby Homes
- 3289 Floyd Springs Rd NE
- 418 Dunaway Gap Rd
- 1216 Everett Springs Rd NE
- 2324 Floyd Springs Rd NE
- 0 Culpepper Rd NE Unit 7592082
- 0 Culpepper Rd NE Unit 7651484
- 0 Culpepper Rd NE Unit TRACT 1 & 2 10607389
- 0 Culpepper Rd NE Unit 10536672
- 0 Culpepper Rd NE Unit TRACT 1 10540091
- 0 Culpepper Rd NE Unit TRACT 2 10540088
- 1434 Culpepper Rd NE
- 260 Lovers Ln NE
- 5452 Old Dalton Rd NE
- 1465 Turner Rd NE
- 325 Everett Springs Rd
- 1603 Floyd Springs Rd NE
- 1194 New Rosedale Rd NE
- 334 Armuchee Trail NE
- 311 Herring Rd NE
- 3436 Floyd Springs Rd NE
- 3500 Floyd Springs Rd NE
- 3506 Floyd Springs Rd NE
- 3522 Floyd Springs Rd NE
- 3588 Floyd Springs Rd NE
- 3593 Floyd Springs Rd NE
- 800 Sally Davis Rd
- 3437 Floyd Springs Rd NE
- 3641 Floyd Springs Rd NE
- 75 Dunaway Gap Rd NE
- 177 Dunaway Gap Rd NE
- 199 Dunaway Gap Rd NE
- 131 Dunaway Gap Rd NE
- 147 Dunaway Gap Rd NE
- 155 Dunaway Gap Rd NE
- 3295 Floyd Springs Rd NE
- 239 Dunaway Gap Rd NE
- 144 Dunaway Gap Rd NE
- 217 Dunaway Gap Rd NE
- 315 Dunaway Gap Rd NE