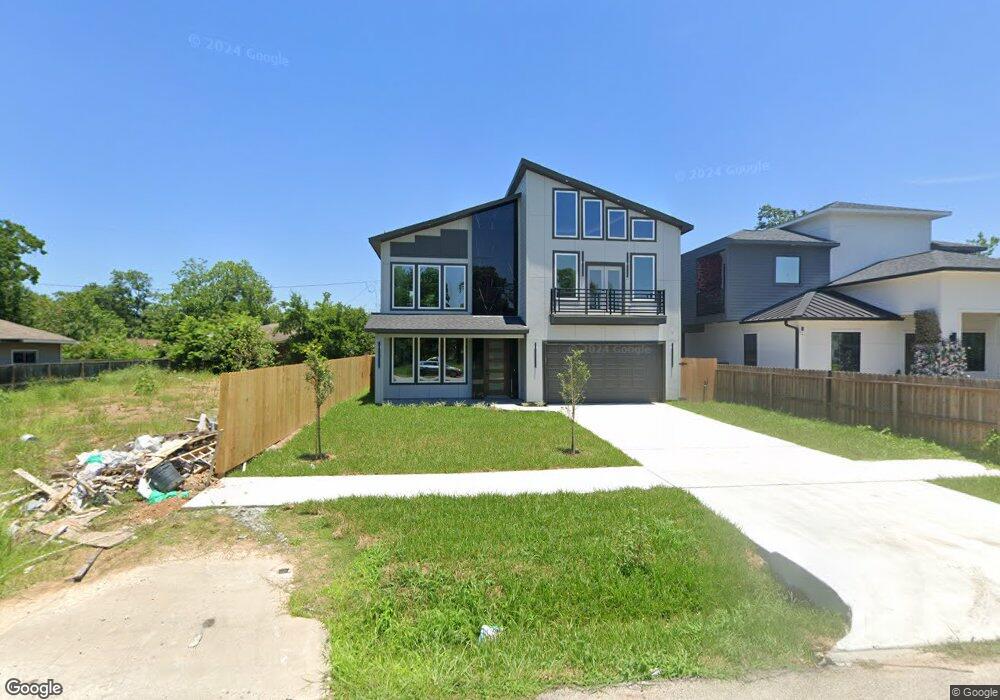
3437/0 Rebecca St Houston, TX 77021
OST-South Union NeighborhoodEstimated Value: $384,081 - $433,000
4
Beds
3
Baths
2,405
Sq Ft
$167/Sq Ft
Est. Value
About This Home
This home is located at 3437/0 Rebecca St, Houston, TX 77021 and is currently estimated at $402,020, approximately $167 per square foot. 3437/0 Rebecca St is a home located in Harris County with nearby schools including Whidby Elementary School, Cullen Middle School, and Yates High School.
Ownership History
Date
Name
Owned For
Owner Type
Purchase Details
Closed on
Jul 31, 2023
Sold by
Adw Construction Llc
Bought by
Greentulip Llc
Current Estimated Value
Purchase Details
Closed on
Nov 9, 2022
Sold by
Network Unlimited Llc
Bought by
Adw Construction Llc
Purchase Details
Closed on
May 26, 2021
Sold by
Nopro Llc
Bought by
Networking Unlimited Llc
Purchase Details
Closed on
Apr 25, 2019
Sold by
Quick House Buyers Llc
Bought by
Nopro Llc
Purchase Details
Closed on
Mar 20, 2019
Sold by
Munawar Samia
Bought by
Quick House Buyers Llc
Purchase Details
Closed on
Sep 24, 2018
Sold by
Sheikh Faiz
Bought by
Munawar Samia
Purchase Details
Closed on
Apr 30, 2014
Sold by
Nationstar Mortgage Llc
Bought by
Sheikh Faiz
Purchase Details
Closed on
Feb 10, 2014
Sold by
Foster Lee A
Bought by
Nationstar Mortgage Llc and Centex Home Equity Co Llc
Create a Home Valuation Report for This Property
The Home Valuation Report is an in-depth analysis detailing your home's value as well as a comparison with similar homes in the area
Home Values in the Area
Average Home Value in this Area
Purchase History
| Date | Buyer | Sale Price | Title Company |
|---|---|---|---|
| Greentulip Llc | -- | None Listed On Document | |
| Adw Construction Llc | -- | Commonwealth Title Of Houston | |
| Networking Unlimited Llc | -- | Providence Title Company | |
| Networking Unlimited Llc | -- | Providence Title Company | |
| Nopro Llc | -- | Providence Title Company | |
| Quick House Buyers Llc | -- | None Available | |
| Munawar Samia | -- | None Available | |
| Sheikh Faiz | -- | Title365 | |
| Nationstar Mortgage Llc | -- | None Available |
Source: Public Records
Tax History Compared to Growth
Tax History
| Year | Tax Paid | Tax Assessment Tax Assessment Total Assessment is a certain percentage of the fair market value that is determined by local assessors to be the total taxable value of land and additions on the property. | Land | Improvement |
|---|---|---|---|---|
| 2025 | $7,471 | $421,620 | $105,000 | $316,620 |
| 2024 | $7,471 | $357,082 | $100,000 | $257,082 |
| 2023 | $7,471 | $100,000 | $100,000 | $0 |
| 2022 | $1,762 | $80,000 | $80,000 | $0 |
| 2021 | $787 | $33,750 | $33,750 | $0 |
| 2020 | $817 | $33,750 | $33,750 | $0 |
| 2019 | $1,319 | $52,135 | $30,000 | $22,135 |
| 2018 | $963 | $38,043 | $15,000 | $23,043 |
| 2017 | $962 | $38,043 | $15,000 | $23,043 |
| 2016 | $904 | $35,740 | $15,000 | $20,740 |
| 2015 | -- | $35,740 | $15,000 | $20,740 |
| 2014 | -- | $46,532 | $15,000 | $31,532 |
Source: Public Records
Map
Nearby Homes
- 3438 Rebecca St
- 3446 Bacon St
- 3405 Rebecca St
- 7613 Lady St
- 3441 Goodhope St
- 3503 Goodhope St
- 3514 Goodhope St Unit A
- 3524 Rebecca St
- 3515 Lydia St
- 3536 Rebecca St
- 3438 Rolgom Place Ct
- 7650 Springhill St Unit 601
- 3421 Mainer St
- 3533 Lydia St
- 3562 Goodhope St
- 3462 Seabrook St
- 3813 Rebecca St
- 3620 Goodhope St
- 3254 Holly Hall St Unit 3254
- 3438 Mount Pleasant St
- 3437 Rebecca St
- 3441 Rebecca St
- 3445 Rebecca St
- 3429 Rebecca St
- 3434 Rebecca St
- 3442 Rebecca St
- 3442 Goodhope St
- 3449 Rebecca St
- 3446 Rebecca St
- 3430 Rebecca St
- 3434 Goodhope St
- 3446 Goodhope St
- 3425 Rebecca St
- 3453 Rebecca St
- 3426 Rebecca St
- 0 Good Hope St
- 3429 Bacon St
- 3454 Rebecca St
- 3454 Goodhope St
- 3437 Bacon St