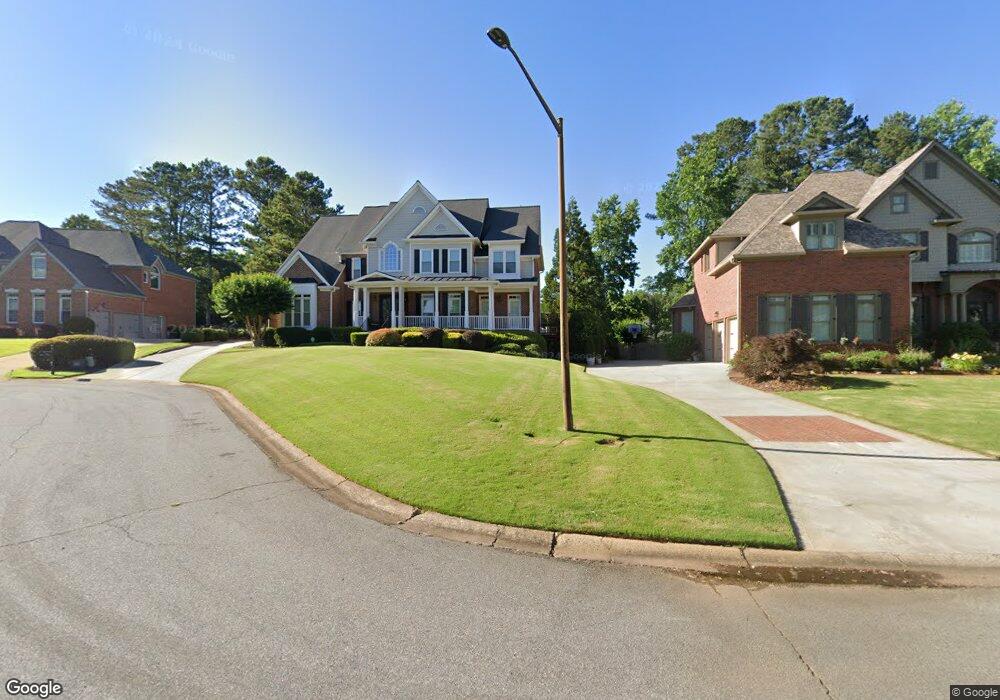
3437 Chartley Ln NE Unit 2 Roswell, GA 30075
East Cobb NeighborhoodEstimated Value: $955,000 - $1,172,000
4
Beds
4
Baths
4,056
Sq Ft
$263/Sq Ft
Est. Value
About This Home
This home is located at 3437 Chartley Ln NE Unit 2, Roswell, GA 30075 and is currently estimated at $1,065,437, approximately $262 per square foot. 3437 Chartley Ln NE Unit 2 is a home located in Cobb County with nearby schools including Tritt Elementary School, Hightower Trail Middle School, and Pope High School.
Ownership History
Date
Name
Owned For
Owner Type
Purchase Details
Closed on
Dec 14, 2022
Sold by
Siegel David Ronald
Bought by
Elisa Jennifer Siegel Revocable Trust
Current Estimated Value
Purchase Details
Closed on
Nov 8, 2000
Sold by
O'Riley Mark C and O'Riley Jane R
Bought by
Siegel David and Siegel Elisa
Home Financials for this Owner
Home Financials are based on the most recent Mortgage that was taken out on this home.
Original Mortgage
$370,000
Interest Rate
7.83%
Mortgage Type
New Conventional
Purchase Details
Closed on
Jun 15, 1998
Sold by
Lost Forrest Bldrs
Bought by
Oriley Mark C and Oriley Jane R
Home Financials for this Owner
Home Financials are based on the most recent Mortgage that was taken out on this home.
Original Mortgage
$360,000
Interest Rate
7.14%
Mortgage Type
New Conventional
Create a Home Valuation Report for This Property
The Home Valuation Report is an in-depth analysis detailing your home's value as well as a comparison with similar homes in the area
Home Values in the Area
Average Home Value in this Area
Purchase History
| Date | Buyer | Sale Price | Title Company |
|---|---|---|---|
| Elisa Jennifer Siegel Revocable Trust | -- | -- | |
| Siegel David | $470,000 | -- | |
| Oriley Mark C | $410,000 | -- |
Source: Public Records
Mortgage History
| Date | Status | Borrower | Loan Amount |
|---|---|---|---|
| Previous Owner | Siegel David | $370,000 | |
| Previous Owner | Oriley Mark C | $360,000 |
Source: Public Records
Tax History Compared to Growth
Tax History
| Year | Tax Paid | Tax Assessment Tax Assessment Total Assessment is a certain percentage of the fair market value that is determined by local assessors to be the total taxable value of land and additions on the property. | Land | Improvement |
|---|---|---|---|---|
| 2025 | $2,828 | $422,212 | $88,000 | $334,212 |
| 2024 | $2,836 | $422,212 | $88,000 | $334,212 |
| 2023 | $8,818 | $367,652 | $78,000 | $289,652 |
| 2022 | $7,767 | $291,568 | $56,000 | $235,568 |
| 2021 | $7,685 | $287,808 | $56,000 | $231,808 |
| 2020 | $7,685 | $287,808 | $56,000 | $231,808 |
| 2019 | $7,685 | $287,808 | $56,000 | $231,808 |
| 2018 | $7,685 | $287,808 | $56,000 | $231,808 |
| 2017 | $6,210 | $233,808 | $50,000 | $183,808 |
| 2016 | $6,215 | $233,808 | $50,000 | $183,808 |
| 2015 | $6,359 | $233,808 | $50,000 | $183,808 |
| 2014 | $6,322 | $230,000 | $0 | $0 |
Source: Public Records
Map
Nearby Homes
- 3333 Trails End Rd NE
- 1533 Tennessee Walker Dr NE
- 4645 Shallowford Rd
- 4618 Shallowford Rd
- 2095 Shallowford Park Manor
- 2990 Mountain Trace NE
- 3025 Creek Ct NE
- 230 Tynebrae Place Unit 1
- 4574 Woodland Cir NE
- 4680 Cambridge Approach Cir NE
- 3453 Drayton Dr NE
- 3616 Hampstead Ln NE
- 2859 Tynewick Dr NE
- 4486 Huffman Dr NE
- 3226 Artessa Ln NE
- 3277 Artessa Ln NE
- 4448 Huffman Dr NE
- 3441 Chartley Ln NE
- 3433 Chartley Ln NE
- 5020 Carriage Lakes Dr NE Unit 1
- 3429 Chartley Ln NE
- 3425 Chartley Ln NE
- 3445 Chartley Ln NE
- 3430 Chartley Ln NE
- 5030 Carriage Lakes Dr NE
- 3421 Chartley Ln NE
- 3442 Chartley Ln NE
- 3122 Denton Place NE Unit 1
- 3438 Chartley Ln NE
- 3124 Denton Place NE Unit 1
- 3422 Chartley Ln NE
- 3417 Chartley Ln NE
- 5021 Carriage Lakes Dr NE
- 3120 Denton Place NE
- 4506 Chartley Cir NE
- 5011 Carriage Lakes Dr NE Unit 1
- 3202 Alston Ct NE