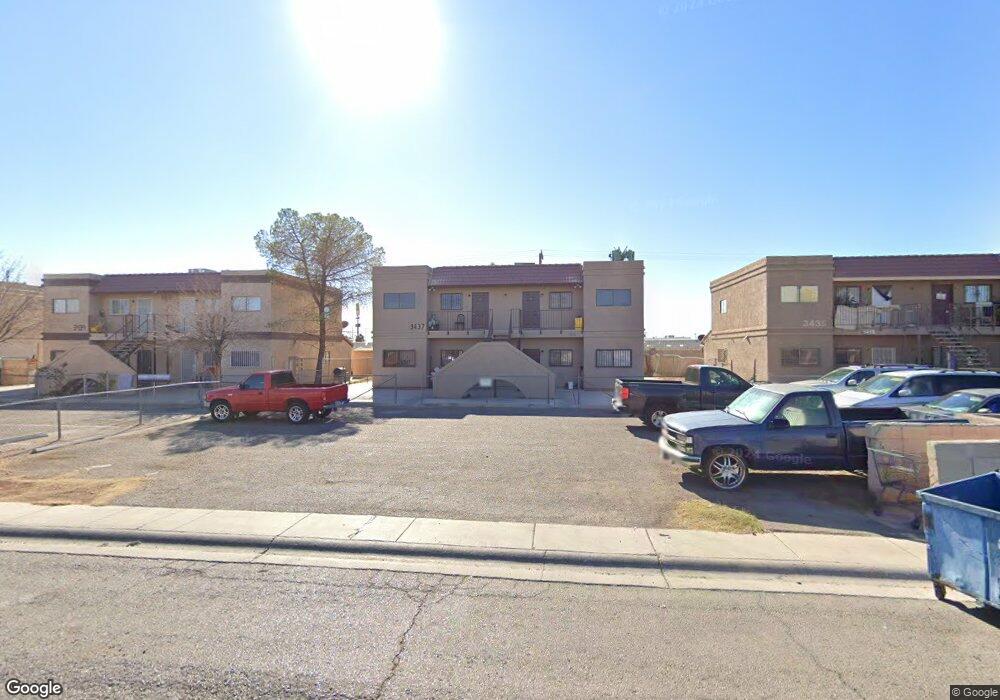
3437 College View Ct North Las Vegas, NV 89030
Downtown North Las Vegas NeighborhoodEstimated Value: $598,000 - $683,000
8
Beds
4
Baths
3,096
Sq Ft
$211/Sq Ft
Est. Value
About This Home
This home is located at 3437 College View Ct, North Las Vegas, NV 89030 and is currently estimated at $652,333, approximately $210 per square foot. 3437 College View Ct is a home located in Clark County with nearby schools including Lois Craig Elementary School, Von Tobel Middle School, and Canyon Springs High School And The Leadership And.
Ownership History
Date
Name
Owned For
Owner Type
Purchase Details
Closed on
Aug 24, 2022
Sold by
Astudillo and Maria
Bought by
George And Maria Astudillo Trust
Current Estimated Value
Purchase Details
Closed on
Mar 24, 1994
Sold by
Taboada Israel and Taboada Hortencia
Bought by
Astudillo George and Astudillo Maria
Purchase Details
Closed on
Nov 3, 1993
Sold by
Cisneros Henry G
Bought by
Astudillo George and Astudillo Maria
Home Financials for this Owner
Home Financials are based on the most recent Mortgage that was taken out on this home.
Original Mortgage
$101,764
Interest Rate
6.97%
Mortgage Type
FHA
Purchase Details
Closed on
Sep 8, 1993
Sold by
Bancplus Mortgage Corporation
Bought by
Secretary Of Housing & Urban Development
Home Financials for this Owner
Home Financials are based on the most recent Mortgage that was taken out on this home.
Original Mortgage
$101,764
Interest Rate
6.97%
Mortgage Type
FHA
Create a Home Valuation Report for This Property
The Home Valuation Report is an in-depth analysis detailing your home's value as well as a comparison with similar homes in the area
Home Values in the Area
Average Home Value in this Area
Purchase History
| Date | Buyer | Sale Price | Title Company |
|---|---|---|---|
| George And Maria Astudillo Trust | -- | None Listed On Document | |
| Astudillo George | -- | -- | |
| Astudillo George | -- | Land Title | |
| Secretary Of Housing & Urban Development | -- | First American Title |
Source: Public Records
Mortgage History
| Date | Status | Borrower | Loan Amount |
|---|---|---|---|
| Previous Owner | Astudillo George | $101,764 |
Source: Public Records
Tax History Compared to Growth
Tax History
| Year | Tax Paid | Tax Assessment Tax Assessment Total Assessment is a certain percentage of the fair market value that is determined by local assessors to be the total taxable value of land and additions on the property. | Land | Improvement |
|---|---|---|---|---|
| 2025 | $1,896 | $89,959 | $42,000 | $47,959 |
| 2024 | $1,756 | $89,959 | $42,000 | $47,959 |
| 2023 | $1,756 | $88,356 | $43,050 | $45,306 |
| 2022 | $1,626 | $79,313 | $35,700 | $43,613 |
| 2021 | $1,506 | $71,688 | $29,750 | $41,938 |
| 2020 | $1,396 | $69,171 | $26,600 | $42,571 |
| 2019 | $1,308 | $65,417 | $22,750 | $42,667 |
| 2018 | $1,248 | $59,100 | $17,500 | $41,600 |
| 2017 | $1,900 | $56,628 | $14,525 | $42,103 |
| 2016 | $1,169 | $46,720 | $12,600 | $34,120 |
| 2015 | $1,166 | $39,398 | $11,200 | $28,198 |
| 2014 | $1,130 | $36,685 | $11,200 | $25,485 |
Source: Public Records
Map
Nearby Homes
- 3429 E Cheyenne Ave
- 3327 Rio Grande St
- 2981 Country Manor Ln Unit 118
- 2981 Country Manor Ln Unit 2
- 3401 N Walnut Rd Unit 305
- 3401 N Walnut Rd Unit 330
- 3401 N Walnut Rd Unit 121
- 3401 N Walnut Rd Unit 113
- 3401 N Walnut Rd Unit 109
- 3401 N Walnut Rd Unit 388
- 3401 N Walnut Rd Unit 235
- 3401 N Walnut Rd Unit 15
- 3401 N Walnut Rd Unit 236
- 3401 N Walnut Rd Unit 74
- 3401 N Walnut Rd Unit 13
- 3401 N Walnut Rd Unit 6
- 3401 N Walnut Rd Unit 402
- 3401 N Walnut Rd Unit 249
- 3401 N Walnut Rd Unit 304
- 3401 N Walnut Rd Unit 67
- 3435 College View Ct
- 3439 College View Ct Unit B
- 3439 College View Ct Unit C
- 3439 College View Ct
- 3439 College View Ct Unit A
- 3439 College View Ct Unit D
- 3433 College View Ct
- 3441 College View Ct
- 3436 College View Ct
- 3438 College View Ct
- 3438 College View Ct Unit C
- 3434 College View Ct
- 3442 College View Ct
- 3431 College View Ct
- 3443 College View Ct
- 3440 College View Ct
- 3432 College View Ct
- 3444 College View Ct
- 3445 College View Ct
- 3040 Diana Dr