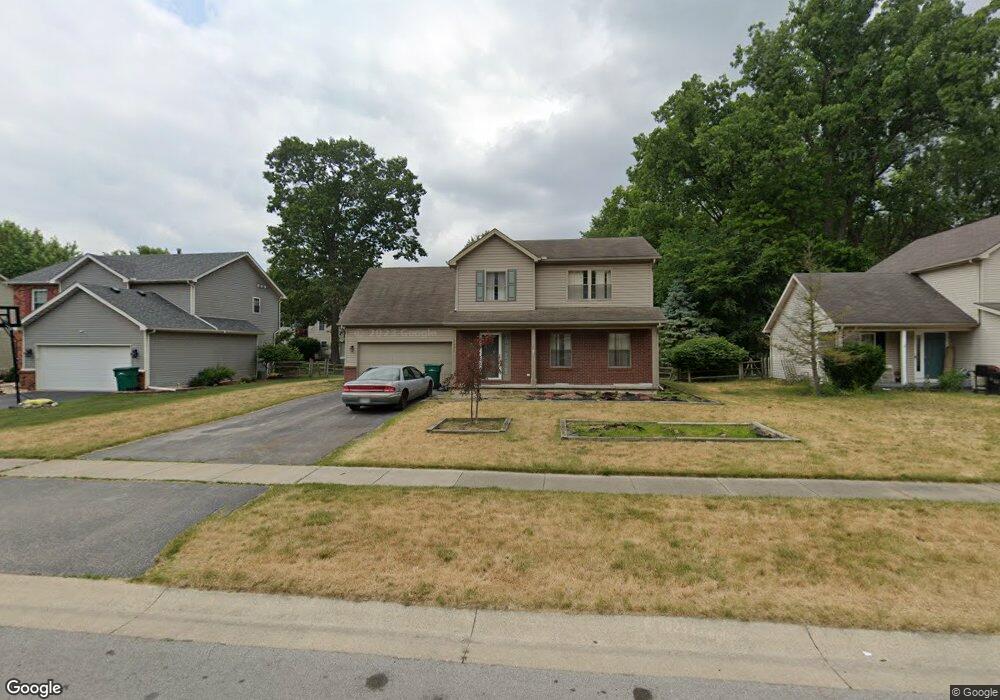
3437 Indian Oaks Ln Toledo, OH 43617
Estimated Value: $268,000 - $318,650
4
Beds
3
Baths
1,936
Sq Ft
$153/Sq Ft
Est. Value
About This Home
This home is located at 3437 Indian Oaks Ln, Toledo, OH 43617 and is currently estimated at $297,163, approximately $153 per square foot. 3437 Indian Oaks Ln is a home located in Lucas County with nearby schools including Stranahan Elementary School, Sylvania Timberstone Junior High School, and Sylvania Southview High School.
Ownership History
Date
Name
Owned For
Owner Type
Purchase Details
Closed on
Aug 8, 2011
Sold by
Fannie Mae
Bought by
Delp Stephen G
Current Estimated Value
Home Financials for this Owner
Home Financials are based on the most recent Mortgage that was taken out on this home.
Original Mortgage
$113,952
Interest Rate
3.87%
Mortgage Type
FHA
Purchase Details
Closed on
May 27, 2010
Sold by
Newbern Tracy M
Bought by
Fanniemae and Federal National Mortgage Association
Purchase Details
Closed on
May 13, 2004
Sold by
Newbern Marcus and Newbern Tracy
Bought by
Newbern Tracy M
Home Financials for this Owner
Home Financials are based on the most recent Mortgage that was taken out on this home.
Original Mortgage
$161,000
Interest Rate
5.25%
Mortgage Type
Unknown
Purchase Details
Closed on
May 15, 2002
Sold by
Newbern Marcus
Bought by
Newbern Marcus and Newbern Tracy
Purchase Details
Closed on
Nov 12, 1997
Sold by
Louisville Title Agency
Bought by
Newbern Marcus
Create a Home Valuation Report for This Property
The Home Valuation Report is an in-depth analysis detailing your home's value as well as a comparison with similar homes in the area
Home Values in the Area
Average Home Value in this Area
Purchase History
| Date | Buyer | Sale Price | Title Company |
|---|---|---|---|
| Delp Stephen G | $125,500 | Ohio Title Corp | |
| Fanniemae | $105,000 | Attorney | |
| Newbern Tracy M | -- | Metro Title Agency Inc | |
| Newbern Marcus | -- | Northwest Title Agency Of Oh | |
| Newbern Marcus | $35,000 | -- |
Source: Public Records
Mortgage History
| Date | Status | Borrower | Loan Amount |
|---|---|---|---|
| Open | Delp Stephen G | $113,952 |
Source: Public Records
Tax History Compared to Growth
Tax History
| Year | Tax Paid | Tax Assessment Tax Assessment Total Assessment is a certain percentage of the fair market value that is determined by local assessors to be the total taxable value of land and additions on the property. | Land | Improvement |
|---|---|---|---|---|
| 2024 | $3,376 | $104,125 | $8,680 | $95,445 |
| 2023 | $4,447 | $57,995 | $8,190 | $49,805 |
| 2022 | $4,472 | $57,995 | $8,190 | $49,805 |
| 2021 | $4,526 | $57,995 | $8,190 | $49,805 |
| 2020 | $4,205 | $47,635 | $6,685 | $40,950 |
| 2019 | $4,053 | $47,635 | $6,685 | $40,950 |
| 2018 | $3,996 | $47,635 | $6,685 | $40,950 |
| 2017 | $4,260 | $45,675 | $6,510 | $39,165 |
| 2016 | $4,180 | $130,500 | $18,600 | $111,900 |
| 2015 | $3,945 | $130,500 | $18,600 | $111,900 |
| 2014 | $3,694 | $43,930 | $6,270 | $37,660 |
| 2013 | $3,694 | $43,930 | $6,270 | $37,660 |
Source: Public Records
Map
Nearby Homes
- 3507 Indian Oaks Ln
- 6606 Blossman Rd
- 3330 Wilford Dr
- 3302 Zone Ave
- 6243 Bonsels Pkwy
- 3757 N Mccord Rd
- 3655 Woodspring Rd
- 2822 Page Lindsay Ln
- 3800 Harrowsfield Rd
- 6537 Woodhall Dr Unit 8
- 4022 Stonehenge Dr Unit 4022
- 6830 Carrietowne Ln Unit 6830
- 6537 Abbey Run Unit D5
- 6006 Westacre Ln
- 6657 Margate Blvd Unit 3
- 6554 Abbey Run Unit 5
- 21 Shenandoah Cir
- 22 Shenandoah Cir
- 6626 Kingsbridge Dr Unit 4
- 6636 Kingsbridge Dr Unit 4
- 3431 Indian Oaks Ln
- 3445 Indian Oaks Ln
- 3436 Indian Trail Ln
- 3430 Indian Trail Ln
- 3423 Indian Oaks Ln
- 3451 Indian Oaks Ln
- 3434 Indian Oaks Ln
- 3422 Indian Trail Ln
- 3446 Indian Oaks Ln
- 3428 Indian Oaks Ln
- 3417 Indian Oaks Ln
- 3500 Indian Oaks Ln
- 3416 Indian Trail Ln
- 3420 Indian Oaks Ln
- 3409 Indian Oaks Ln
- 3506 Indian Oaks Ln
- 3513 Indian Oaks Ln
- 3435 Indian Trail Ln
- 3414 Indian Oaks Ln
- 3429 Indian Trail Ln