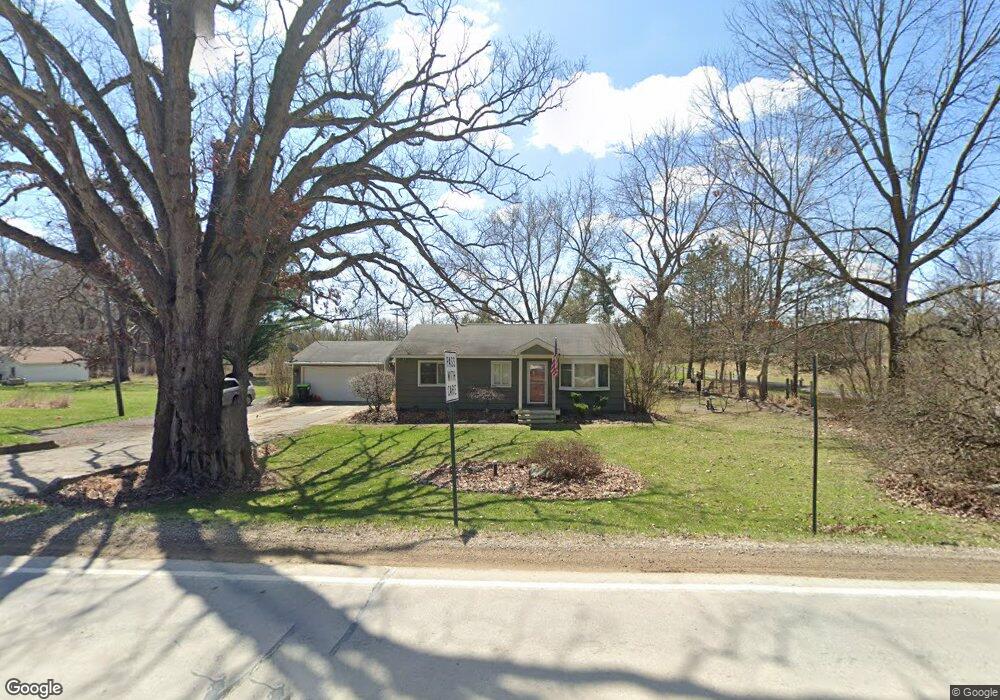
3437 W Coon Lake Rd Howell, MI 48843
Estimated Value: $246,448 - $366,000
--
Bed
--
Bath
1,140
Sq Ft
$282/Sq Ft
Est. Value
About This Home
This home is located at 3437 W Coon Lake Rd, Howell, MI 48843 and is currently estimated at $321,612, approximately $282 per square foot. 3437 W Coon Lake Rd is a home located in Livingston County with nearby schools including Southwest Elementary School, Parker Middle School, and Howell High School.
Ownership History
Date
Name
Owned For
Owner Type
Purchase Details
Closed on
May 8, 2003
Sold by
Stiltner Richard Lee
Bought by
Margo Danna and Stiltner Danna L
Current Estimated Value
Home Financials for this Owner
Home Financials are based on the most recent Mortgage that was taken out on this home.
Original Mortgage
$115,000
Outstanding Balance
$44,352
Interest Rate
4.25%
Mortgage Type
Purchase Money Mortgage
Estimated Equity
$277,260
Purchase Details
Closed on
Dec 29, 1998
Sold by
Stiltner Richard L and Margo Danna L
Bought by
Stiltner Richard L and Stiltner Danna L
Home Financials for this Owner
Home Financials are based on the most recent Mortgage that was taken out on this home.
Original Mortgage
$117,000
Interest Rate
6.76%
Purchase Details
Closed on
Sep 18, 1995
Sold by
Capra Michael J
Bought by
Lacour Michael and Lacour Annette
Home Financials for this Owner
Home Financials are based on the most recent Mortgage that was taken out on this home.
Original Mortgage
$75,000
Interest Rate
8%
Mortgage Type
New Conventional
Create a Home Valuation Report for This Property
The Home Valuation Report is an in-depth analysis detailing your home's value as well as a comparison with similar homes in the area
Home Values in the Area
Average Home Value in this Area
Purchase History
| Date | Buyer | Sale Price | Title Company |
|---|---|---|---|
| Margo Danna | -- | Citizens Title Services Inc | |
| Stiltner Richard L | -- | -- | |
| Lacour Michael | $98,100 | -- |
Source: Public Records
Mortgage History
| Date | Status | Borrower | Loan Amount |
|---|---|---|---|
| Open | Margo Danna | $115,000 | |
| Closed | Stiltner Richard L | $117,000 | |
| Closed | Lacour Michael | $75,000 |
Source: Public Records
Tax History Compared to Growth
Tax History
| Year | Tax Paid | Tax Assessment Tax Assessment Total Assessment is a certain percentage of the fair market value that is determined by local assessors to be the total taxable value of land and additions on the property. | Land | Improvement |
|---|---|---|---|---|
| 2025 | $1,423 | $103,100 | $0 | $0 |
| 2024 | $948 | $112,000 | $0 | $0 |
| 2023 | $905 | $83,900 | $0 | $0 |
| 2022 | $1,235 | $74,900 | $0 | $0 |
| 2021 | $1,200 | $74,900 | $0 | $0 |
| 2020 | $1,223 | $71,900 | $0 | $0 |
| 2019 | $1,205 | $71,600 | $0 | $0 |
| 2018 | $1,195 | $65,600 | $0 | $0 |
| 2017 | $1,177 | $65,600 | $0 | $0 |
| 2016 | $1,175 | $60,800 | $0 | $0 |
| 2014 | $1,225 | $52,800 | $0 | $0 |
| 2012 | $1,225 | $49,800 | $0 | $0 |
Source: Public Records
Map
Nearby Homes
- 3690 W Coon Lake Rd
- 3447 Mayberry Ln
- 2763 Clivedon Rd
- 2921 Clivedon Rd
- 3760 Southwick Dr
- 3145 Cedar Lake Rd
- 2509 Rubbins Rd
- 3529 Prescott Dr Unit 40
- 2960 Cedar Lake Rd
- 2214 White Hawk Trail
- 3362 Prescott Dr
- 4009 Cactus Flower Ct
- 1286 Gray Fox Ct
- 2699 Cedar Lake Rd
- 2145 Sexton Rd
- 4033 Jewell Rd
- 870 County Farm Rd
- 2223 Hidden Valley Rd
- 945 Gray Fox Ct
- Parcel A Pingree Rd
- 3405 W Coon Lake Rd
- 3440 W Coon Lake Rd
- 3475 W Coon Lake Rd
- 3411 W Coon Lake Rd
- 3346 W Coon Lake Rd
- 3456 Mayberry Rd
- 3434 Mayberry Rd
- 3301 W Coon Lake Rd
- 3392 Mayberry Rd
- 3480 Mayberry Rd
- 3310 W Coon Lake Rd
- 3554 W Coon Lake Rd
- 3260 W Coon Lake Rd
- 3455 W Coon Lake Rd
- 3355 Mayberry Rd
- 3828 Bentley Lake Rd
- VL Brighton Rd
- 3456 Mayberry Ln
- 3218 W Coon Lake Rd
- 3334 W Coon Lake Rd