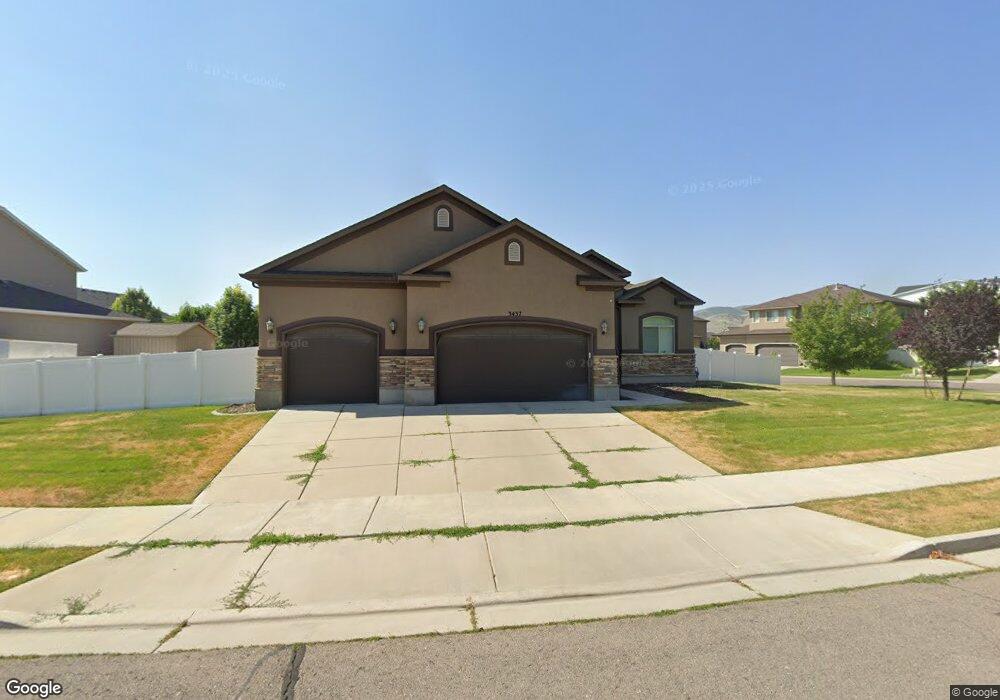
3437 W Corsica Dr Riverton, UT 84065
Estimated Value: $758,000 - $786,954
3
Beds
3
Baths
1,868
Sq Ft
$412/Sq Ft
Est. Value
About This Home
This home is located at 3437 W Corsica Dr, Riverton, UT 84065 and is currently estimated at $769,989, approximately $412 per square foot. 3437 W Corsica Dr is a home located in Salt Lake County with nearby schools including Rose Creek School, Oquirrh Hills Middle School, and Riverton High School.
Ownership History
Date
Name
Owned For
Owner Type
Purchase Details
Closed on
Sep 8, 2022
Sold by
Dewaters Athena C
Bought by
Dewaters Athena C
Current Estimated Value
Home Financials for this Owner
Home Financials are based on the most recent Mortgage that was taken out on this home.
Original Mortgage
$670,499
Outstanding Balance
$640,839
Interest Rate
5.3%
Mortgage Type
VA
Estimated Equity
$129,150
Purchase Details
Closed on
Sep 28, 2010
Sold by
D R Horton Inc
Bought by
Wells Stephen R and Wells Stephanie A
Home Financials for this Owner
Home Financials are based on the most recent Mortgage that was taken out on this home.
Original Mortgage
$312,618
Interest Rate
4.25%
Mortgage Type
FHA
Purchase Details
Closed on
Sep 21, 2010
Sold by
D R Horton Inc
Bought by
Dewaters Athena C and Dewaters Dylan T
Home Financials for this Owner
Home Financials are based on the most recent Mortgage that was taken out on this home.
Original Mortgage
$312,618
Interest Rate
4.25%
Mortgage Type
FHA
Create a Home Valuation Report for This Property
The Home Valuation Report is an in-depth analysis detailing your home's value as well as a comparison with similar homes in the area
Home Values in the Area
Average Home Value in this Area
Purchase History
| Date | Buyer | Sale Price | Title Company |
|---|---|---|---|
| Dewaters Athena C | $150,000 | Amrock | |
| Dewaters Athena C | $150,000 | Amrock | |
| Wells Stephen R | -- | Highland Title Agency | |
| Dewaters Athena C | -- | Highland Title Agency |
Source: Public Records
Mortgage History
| Date | Status | Borrower | Loan Amount |
|---|---|---|---|
| Open | Dewaters Athena C | $670,499 | |
| Closed | Dewaters Athena C | $670,499 | |
| Previous Owner | Wells Stephen R | $312,618 | |
| Previous Owner | Dewaters Athena C | $322,794 |
Source: Public Records
Tax History Compared to Growth
Tax History
| Year | Tax Paid | Tax Assessment Tax Assessment Total Assessment is a certain percentage of the fair market value that is determined by local assessors to be the total taxable value of land and additions on the property. | Land | Improvement |
|---|---|---|---|---|
| 2025 | $3,992 | $721,600 | $227,900 | $493,700 |
| 2024 | $3,992 | $691,000 | $218,300 | $472,700 |
| 2023 | $4,044 | $659,800 | $214,000 | $445,800 |
| 2022 | $4,201 | $672,400 | $209,800 | $462,600 |
| 2021 | $3,532 | $503,300 | $167,800 | $335,500 |
| 2020 | $3,359 | $446,300 | $167,800 | $278,500 |
| 2019 | $3,335 | $435,600 | $135,300 | $300,300 |
| 2018 | $3,165 | $407,000 | $132,200 | $274,800 |
| 2017 | $3,086 | $386,800 | $132,200 | $254,600 |
| 2016 | $3,019 | $363,100 | $132,200 | $230,900 |
| 2015 | $2,889 | $336,900 | $130,900 | $206,000 |
| 2014 | $2,535 | $289,800 | $124,600 | $165,200 |
Source: Public Records
Map
Nearby Homes
- 3428 W Chatel Dr
- 13283 S Lucky Dog Ln
- 3277 W 13120 S
- 13849 S Wasatch Vista Dr
- 12906 Verona Creek Way
- 4056 W Muley Ct
- 4177 W 13400 S
- 14277 Keely Ct
- 14332 S Keely Ct Unit 12
- 14371 S Jayden Mae Dr Unit 21
- 2859 Country Classic Dr
- 4102 W Madingley Cir
- 12580 S Janice Dr
- 4162 W Gate Keeper Dr Unit 705
- 4206 W Dead Horse Ct Unit 481
- 13596 S 2260 W
- 12988 S Cohab Canyon Ct
- 14226 S Bella Vea Dr
- 4352 W Rex Peak Way
- 14553 S 3400 W
- 3411 W Corsica Dr
- 3418 W Trentino Dr
- 13536 Cervina Way
- 3428 W Corsica Dr
- 13532 S Cervina Way
- 3399 W Corsica Dr
- 3412 W Corsica Dr
- 13509 Cervina Way
- 13542 S Cervina Way
- 13512 S Cervina Way
- 3398 W Corsica Dr
- 13501 Cervina Way
- 13508 Cervina Way
- 3389 W Corsica Dr
- 3392 W Trentino Dr
- 13501 S Cervina Way
- 3433 Zermatt Dr
- 3433 W Zermatt Dr
- 3429 Zermatt Dr
- 3429 W Zermatt Dr