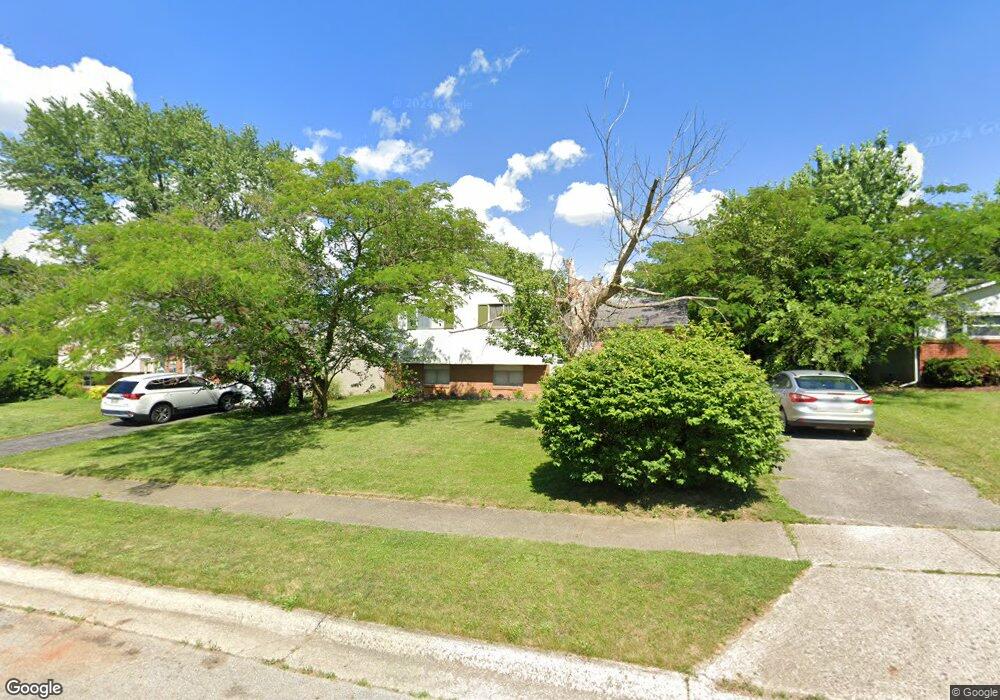
3438 Burbank Rd Columbus, OH 43232
East Columbus-White Ash NeighborhoodEstimated Value: $194,000 - $203,000
3
Beds
1
Bath
1,284
Sq Ft
$153/Sq Ft
Est. Value
About This Home
This home is located at 3438 Burbank Rd, Columbus, OH 43232 and is currently estimated at $196,924, approximately $153 per square foot. 3438 Burbank Rd is a home located in Franklin County with nearby schools including Groveport Madison High School, Eastland Preparatory Academy, and Zenith Academy East.
Ownership History
Date
Name
Owned For
Owner Type
Purchase Details
Closed on
Sep 30, 2011
Sold by
Secretary Of Housing & Urban Development
Bought by
Waltz Jerry and Waltz Jennifer
Current Estimated Value
Purchase Details
Closed on
Jun 11, 2010
Sold by
Jones Rachel N and Case #09Cve 04 5493
Bought by
Us Bank Na
Purchase Details
Closed on
May 18, 2010
Sold by
Us Bank Na
Bought by
Secretary Of Housing & Urban Development
Purchase Details
Closed on
Feb 29, 2008
Sold by
Fox Lynn
Bought by
Jones Rachel N
Home Financials for this Owner
Home Financials are based on the most recent Mortgage that was taken out on this home.
Original Mortgage
$75,810
Interest Rate
5.74%
Mortgage Type
FHA
Purchase Details
Closed on
Jul 11, 2005
Sold by
Copley Milton
Bought by
Fox Lynn
Purchase Details
Closed on
Aug 11, 1989
Bought by
Copley Milton and Copley Sue C
Create a Home Valuation Report for This Property
The Home Valuation Report is an in-depth analysis detailing your home's value as well as a comparison with similar homes in the area
Home Values in the Area
Average Home Value in this Area
Purchase History
| Date | Buyer | Sale Price | Title Company |
|---|---|---|---|
| Waltz Jerry | $27,654 | Valmer Land | |
| Us Bank Na | $48,000 | None Available | |
| Secretary Of Housing & Urban Development | -- | None Available | |
| Jones Rachel N | $77,000 | Valmer Land | |
| Fox Lynn | -- | -- | |
| Copley Milton | -- | -- |
Source: Public Records
Mortgage History
| Date | Status | Borrower | Loan Amount |
|---|---|---|---|
| Previous Owner | Jones Rachel N | $75,810 |
Source: Public Records
Tax History Compared to Growth
Tax History
| Year | Tax Paid | Tax Assessment Tax Assessment Total Assessment is a certain percentage of the fair market value that is determined by local assessors to be the total taxable value of land and additions on the property. | Land | Improvement |
|---|---|---|---|---|
| 2024 | $2,830 | $57,160 | $14,390 | $42,770 |
| 2023 | $2,811 | $57,160 | $14,390 | $42,770 |
| 2022 | $1,899 | $30,630 | $6,480 | $24,150 |
| 2021 | $1,942 | $30,630 | $6,480 | $24,150 |
| 2020 | $1,947 | $30,630 | $6,480 | $24,150 |
| 2019 | $1,866 | $25,800 | $5,390 | $20,410 |
| 2018 | $1,915 | $25,800 | $5,390 | $20,410 |
| 2017 | $1,920 | $25,800 | $5,390 | $20,410 |
| 2016 | $1,952 | $24,230 | $5,220 | $19,010 |
| 2015 | $1,954 | $24,230 | $5,220 | $19,010 |
| 2014 | $1,798 | $24,230 | $5,220 | $19,010 |
| 2013 | $874 | $26,915 | $5,810 | $21,105 |
Source: Public Records
Map
Nearby Homes
- 4655 Glengate Dr
- 4496 Reinbeau Dr
- 4468 Reinbeau Dr
- 4521 Helen Dr
- 4485 Helen Dr
- 4486 Helen Dr
- 4479 Gerling Blvd
- 4940 Brewster Dr
- 5044 Albany Dr
- 3856 Crestfield Dr Unit 3856
- 3900 Noe Bixby Rd
- 5106 Harbor Blvd
- 3493 Tremaine Rd
- 3455 Tremaine Rd
- 5096 Fullerton Dr
- 5174 Fullerton Dr
- 4784 Nieles Edge Dr
- 3275 Faycrest Rd
- 4847 Amber Crossing Dr
- 5152 Burdett Dr
- 3446 Burbank Rd
- 3430 Burbank Rd
- 3451 Reinbeau Ct
- 3454 Burbank Rd
- 3422 Burbank Rd
- 3443 Reinbeau Ct
- 3459 Reinbeau Ct
- 3437 Burbank Rd
- 3443 Burbank Rd
- 3429 Burbank Rd
- 3435 Reinbeau Ct
- 3414 Burbank Rd
- 3455 Burbank Rd
- 3462 Burbank Rd
- 3423 Burbank Rd
- 4628 Glengate Dr
- 3467 Reinbeau Ct
- 3427 Reinbeau Ct
- 3463 Burbank Rd
- 4636 Glengate Dr