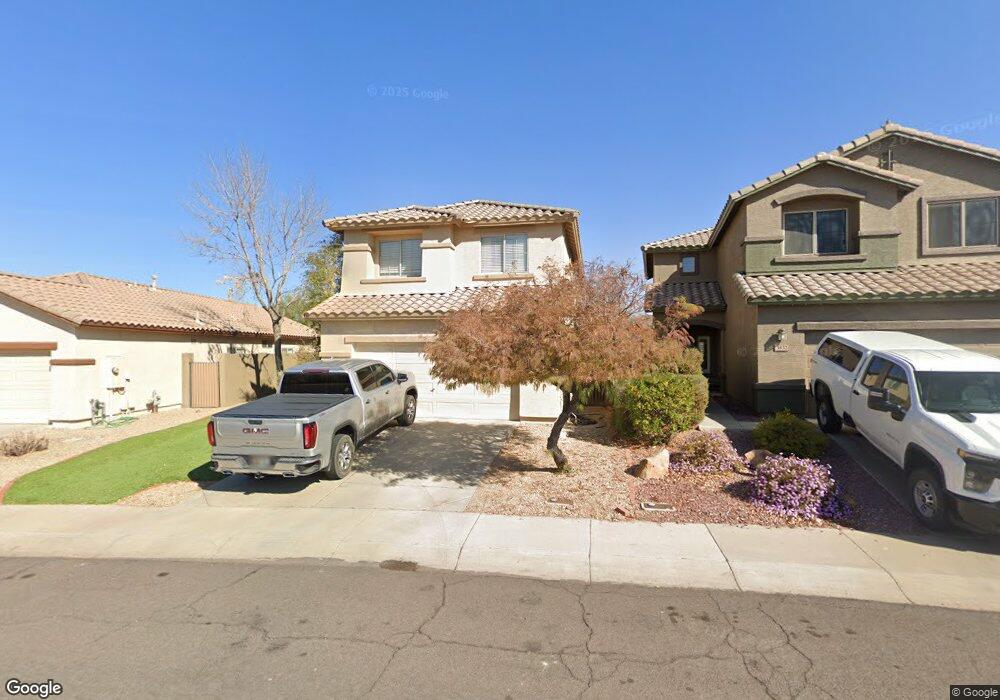
3438 W Steinbeck Dr Anthem, AZ 85086
Estimated Value: $460,544 - $547,000
--
Bed
3
Baths
2,140
Sq Ft
$240/Sq Ft
Est. Value
About This Home
This home is located at 3438 W Steinbeck Dr, Anthem, AZ 85086 and is currently estimated at $512,886, approximately $239 per square foot. 3438 W Steinbeck Dr is a home located in Maricopa County with nearby schools including Anthem School, Boulder Creek High School, and BASIS Phoenix North.
Ownership History
Date
Name
Owned For
Owner Type
Purchase Details
Closed on
Oct 21, 2019
Sold by
Johnson Alan P and Johnson Traclanne
Bought by
Carberry Andrew J and Johnson Julia A
Current Estimated Value
Home Financials for this Owner
Home Financials are based on the most recent Mortgage that was taken out on this home.
Original Mortgage
$305,170
Outstanding Balance
$265,959
Interest Rate
3.25%
Mortgage Type
FHA
Estimated Equity
$246,927
Purchase Details
Closed on
Dec 22, 1999
Sold by
Del Webbs Coventry Homes Inc
Bought by
Johnson Alan P and Johnson Tracianne
Home Financials for this Owner
Home Financials are based on the most recent Mortgage that was taken out on this home.
Original Mortgage
$120,300
Interest Rate
10.5%
Mortgage Type
FHA
Purchase Details
Closed on
Jan 22, 1999
Sold by
Anthem Arizona Llc
Bought by
Del Webbs Coventry Homes Inc
Create a Home Valuation Report for This Property
The Home Valuation Report is an in-depth analysis detailing your home's value as well as a comparison with similar homes in the area
Home Values in the Area
Average Home Value in this Area
Purchase History
| Date | Buyer | Sale Price | Title Company |
|---|---|---|---|
| Carberry Andrew J | $310,800 | First American Title Ins Co | |
| Johnson Alan P | $150,431 | First American Title | |
| Del Webbs Coventry Homes Inc | -- | First American Title |
Source: Public Records
Mortgage History
| Date | Status | Borrower | Loan Amount |
|---|---|---|---|
| Open | Carberry Andrew J | $305,170 | |
| Previous Owner | Johnson Alan P | $120,300 |
Source: Public Records
Tax History Compared to Growth
Tax History
| Year | Tax Paid | Tax Assessment Tax Assessment Total Assessment is a certain percentage of the fair market value that is determined by local assessors to be the total taxable value of land and additions on the property. | Land | Improvement |
|---|---|---|---|---|
| 2025 | $2,551 | $23,762 | -- | -- |
| 2024 | $2,400 | $22,631 | -- | -- |
| 2023 | $2,400 | $36,450 | $7,290 | $29,160 |
| 2022 | $2,294 | $26,620 | $5,320 | $21,300 |
| 2021 | $2,362 | $24,610 | $4,920 | $19,690 |
| 2020 | $2,310 | $23,080 | $4,610 | $18,470 |
| 2019 | $2,266 | $22,050 | $4,410 | $17,640 |
| 2018 | $2,194 | $20,650 | $4,130 | $16,520 |
| 2017 | $2,151 | $19,410 | $3,880 | $15,530 |
| 2016 | $1,845 | $18,360 | $3,670 | $14,690 |
| 2015 | $1,790 | $17,230 | $3,440 | $13,790 |
Source: Public Records
Map
Nearby Homes
- 40915 N Columbia Trail
- 3437 W Walden Way
- 3546 W Webster Ct Unit 6
- 40924 N Crockett Trail
- 3629 W Amerigo Ct Unit 41B
- 40711 N Ericson Ln
- 3723 W Memorial Dr
- 41310 N Clear Crossing Ct
- 40701 N Union Trail
- 41646 N Emerald Lake Dr
- 3716 W Medinah Way
- 3747 W Memorial Dr Unit 67
- 3635 W Mccauley Ct
- 3033 W Keller Dr
- 3737 W Medinah Way
- 3051 W Sousa Ct
- 40128 N Integrity Trail
- 3662 W Mccauley Ct Unit 101
- 3673 W Bryce Ct
- 3703 W Mccauley Ct
- 3444 W Steinbeck Dr
- 3432 W Steinbeck Dr
- 3426 W Steinbeck Dr
- 3450 W Steinbeck Dr
- 3420 W Steinbeck Dr
- 3429 W Steinbeck Dr
- 3456 W Steinbeck Dr
- 3443 W Steinbeck Dr Unit **SHARP
- 3443 W Steinbeck Dr
- 3414 W Steinbeck Dr
- 3419 W Steinbeck Dr
- 40942 N Columbia Trail
- 40936 N Columbia Trail Unit 5
- 3413 W Steinbeck Dr Unit 5
- 3408 W Steinbeck Dr
- 40930 N Columbia Trail
- 40927 N Columbia Trail
- 3402 W Steinbeck Dr Unit 5
- 40924 N Columbia Trail
- 3401 W Steinbeck Dr Unit 5