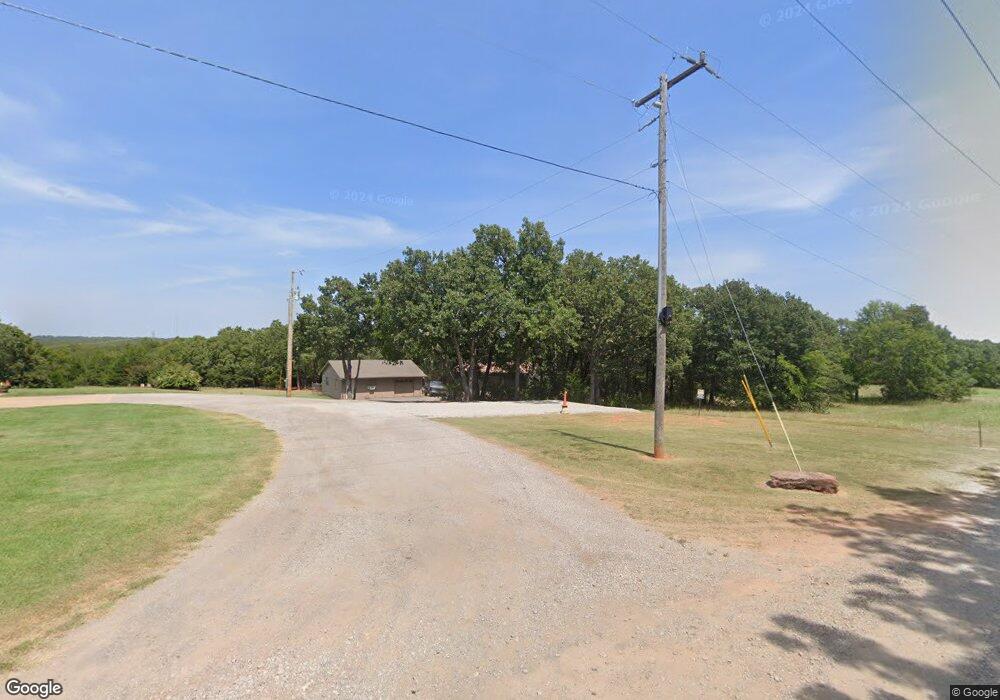
343822 E 890 Rd Chandler, OK 74834
Estimated Value: $215,000 - $417,000
3
Beds
3
Baths
2,343
Sq Ft
$142/Sq Ft
Est. Value
About This Home
This home is located at 343822 E 890 Rd, Chandler, OK 74834 and is currently estimated at $333,478, approximately $142 per square foot. 343822 E 890 Rd is a home located in Lincoln County with nearby schools including East Side Elementary School, Park Road Elementary School, and Chandler Junior High School.
Ownership History
Date
Name
Owned For
Owner Type
Purchase Details
Closed on
Feb 25, 2013
Sold by
Bridges Deveral and Bridges Robin
Bought by
Phipps Dax Chasson and Pickett Jennifer Lynne
Current Estimated Value
Home Financials for this Owner
Home Financials are based on the most recent Mortgage that was taken out on this home.
Original Mortgage
$104,000
Interest Rate
3.44%
Mortgage Type
New Conventional
Purchase Details
Closed on
Feb 5, 2009
Sold by
Mattheyer Wes and Mattheyer Stacie
Bought by
Bridges Deveral and Bridges Robin
Home Financials for this Owner
Home Financials are based on the most recent Mortgage that was taken out on this home.
Original Mortgage
$184,000
Interest Rate
5.17%
Mortgage Type
New Conventional
Purchase Details
Closed on
Aug 27, 1999
Sold by
Bolz Vella King
Bought by
Bridges Deveral and Bridges Robin
Purchase Details
Closed on
Sep 2, 1976
Sold by
Bolz Carl and Vella King
Bought by
Bridges Deveral and Bridges Robin
Create a Home Valuation Report for This Property
The Home Valuation Report is an in-depth analysis detailing your home's value as well as a comparison with similar homes in the area
Home Values in the Area
Average Home Value in this Area
Purchase History
| Date | Buyer | Sale Price | Title Company |
|---|---|---|---|
| Phipps Dax Chasson | $204,000 | None Available | |
| Bridges Deveral | $75,000 | None Available | |
| Bridges Deveral | -- | -- | |
| Bridges Deveral | $3,700 | -- |
Source: Public Records
Mortgage History
| Date | Status | Borrower | Loan Amount |
|---|---|---|---|
| Closed | Phipps Dax Chasson | $104,000 | |
| Previous Owner | Bridges Deveral | $184,000 |
Source: Public Records
Tax History Compared to Growth
Tax History
| Year | Tax Paid | Tax Assessment Tax Assessment Total Assessment is a certain percentage of the fair market value that is determined by local assessors to be the total taxable value of land and additions on the property. | Land | Improvement |
|---|---|---|---|---|
| 2024 | $2,391 | $25,702 | $3,405 | $22,297 |
| 2023 | $2,391 | $27,827 | $3,405 | $24,422 |
| 2022 | $2,174 | $25,923 | $3,090 | $22,833 |
| 2021 | $2,162 | $25,168 | $2,993 | $22,175 |
| 2020 | $2,155 | $24,381 | $2,009 | $22,372 |
| 2019 | $2,123 | $23,670 | $1,942 | $21,728 |
| 2018 | $2,023 | $22,982 | $2,038 | $20,944 |
| 2017 | $2,045 | $23,092 | $2,186 | $20,906 |
| 2016 | $1,883 | $21,763 | $1,650 | $20,113 |
| 2015 | $1,845 | $21,130 | $1,650 | $19,480 |
| 2014 | $2,045 | $22,313 | $2,555 | $19,758 |
Source: Public Records
Map
Nearby Homes
- 343248 E 890 Rd
- 0 N Oak Ave
- 511 Turner Rd
- 200 N Dewey Ave
- 344768 E 890 Rd
- 0000 E 890 Rd
- 315 S Price Ave
- 407 Manvel Ave
- 412 S Cleveland Ave
- 414 S Price Ave
- 0 E 1st St
- 880612 S 3450 Rd
- 709 S Dewey Ave
- 218 E 8th St
- 201 W 8th St
- 802 Bennett Blvd
- 302 W 9th St
- 912 Tilghman Dr
- 320 E 11th St
- 343679 Round Rock Dr
- 101 Wright Ln
- 100 Wright Ln
- 343890 E 890 Rd
- 1350 N Price Ave
- 1200 N Price Ave Unit 18
- 0 N Hwy 18 Hwy Unit 1032122
- 0 N Hwy 18 Hwy Unit 1544779
- 344342 E 890 Rd
- 1100 N Price Ave Unit 18
- 9455 Ns 339
- 646 Rr 3
- 1113 N Price Ave
- 343293 E 890 Rd
- 9699 S Highway 18
- 1115 N Price Ave
- 343238 E 890 Rd
- 700 N Blaine Ave
- 0 N Highway 18 Hwy Unit 1070420
- 0 N Highway 18 Hwy Unit 1026704
- 344353 E 890 Rd