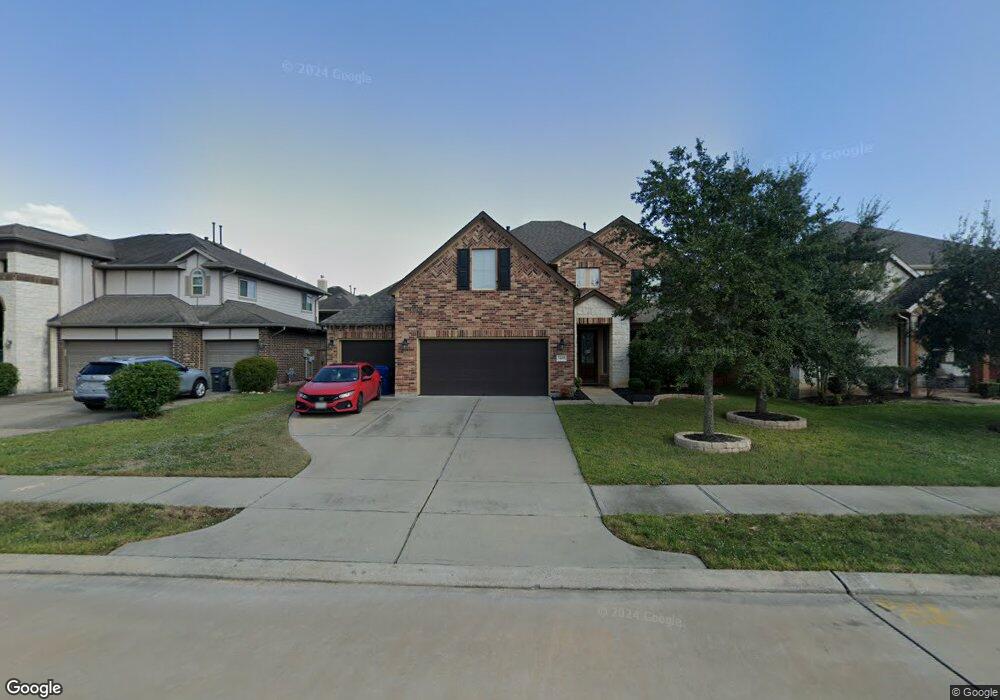
3439 Norwich Gardens Fulshear, TX 77441
Estimated Value: $500,000 - $554,000
4
Beds
4
Baths
2,999
Sq Ft
$174/Sq Ft
Est. Value
About This Home
This home is located at 3439 Norwich Gardens, Fulshear, TX 77441 and is currently estimated at $520,342, approximately $173 per square foot. 3439 Norwich Gardens is a home located in Fort Bend County with nearby schools including Campbell Elementary School, Joe M. Adams Junior High, and Sugar Creek Montessori - Fulshear/West Katy.
Ownership History
Date
Name
Owned For
Owner Type
Purchase Details
Closed on
Mar 15, 2021
Sold by
Gray James and Gray Christine
Bought by
Luong Angie Jade
Current Estimated Value
Home Financials for this Owner
Home Financials are based on the most recent Mortgage that was taken out on this home.
Original Mortgage
$324,000
Outstanding Balance
$290,443
Interest Rate
2.7%
Mortgage Type
New Conventional
Estimated Equity
$229,899
Purchase Details
Closed on
Aug 19, 2016
Sold by
Beazer Homes Texas Lp
Bought by
Gary James and Gary Christine
Home Financials for this Owner
Home Financials are based on the most recent Mortgage that was taken out on this home.
Original Mortgage
$235,192
Interest Rate
3.45%
Mortgage Type
New Conventional
Purchase Details
Closed on
Oct 23, 2014
Sold by
Taylor Morrison Of Texas Inc
Bought by
Gray James and Gray Christine
Purchase Details
Closed on
Dec 10, 2013
Sold by
Taylor Morrison Of Texas Inc
Bought by
Gray James and Gray Christine
Create a Home Valuation Report for This Property
The Home Valuation Report is an in-depth analysis detailing your home's value as well as a comparison with similar homes in the area
Home Values in the Area
Average Home Value in this Area
Purchase History
| Date | Buyer | Sale Price | Title Company |
|---|---|---|---|
| Luong Angie Jade | -- | None Available | |
| Gary James | -- | First American Title | |
| Gray James | -- | -- | |
| Gray James | -- | -- | |
| Gray James | -- | -- |
Source: Public Records
Mortgage History
| Date | Status | Borrower | Loan Amount |
|---|---|---|---|
| Open | Luong Angie Jade | $324,000 | |
| Previous Owner | Gray James | $235,192 |
Source: Public Records
Tax History Compared to Growth
Tax History
| Year | Tax Paid | Tax Assessment Tax Assessment Total Assessment is a certain percentage of the fair market value that is determined by local assessors to be the total taxable value of land and additions on the property. | Land | Improvement |
|---|---|---|---|---|
| 2025 | $10,299 | $455,074 | $74,880 | $380,194 |
| 2024 | $10,299 | $487,157 | $74,880 | $412,277 |
| 2023 | $9,837 | $455,334 | $57,600 | $397,734 |
| 2022 | $11,164 | $434,000 | $57,600 | $376,400 |
| 2021 | $8,988 | $312,690 | $57,600 | $255,090 |
| 2020 | $9,129 | $311,350 | $52,380 | $258,970 |
| 2019 | $9,685 | $309,370 | $52,380 | $256,990 |
| 2018 | $9,521 | $303,630 | $52,380 | $251,250 |
| 2017 | $9,580 | $305,040 | $52,380 | $252,660 |
| 2016 | $1,131 | $36,000 | $36,000 | $0 |
| 2015 | $210 | $10,000 | $10,000 | $0 |
| 2014 | $211 | $10,000 | $10,000 | $0 |
Source: Public Records
Map
Nearby Homes
- 3422 Walker Falls Ln
- 3438 Cartwright Cliff Ln
- 28131 Twin Knolls Ln
- 27830 Hunters Rock Ln
- 27834 Hunters Rock Ln
- 3314 Flint Valley Ln
- 27603 Huggins Crest Ct
- 3710 Meadowmist Ct
- 27514 Wilson Run Ln
- 27719 Merchant Hills Ln
- 27423 Sunrise Ranch Ln
- 27419 Canyon Reach Dr
- 27411 Canyon Reach Dr
- 27414 Wooded Canyon Dr
- 27414 Hollow Pass Ln
- 3523 Shearwater St
- 27803 Indigo Pointe Ln
- 27415 Royal Canyon Ln
- 3527 Shearwater St
- 4110 Addison Ranch Ln
- 3439 Norwich Gardens Ln
- 3443 Norwich Gardens
- 3435 Norwich Gardens Ln
- 3442 Norwich Gardens Ln
- 3431 Norwich Gardens Ln
- 3450 Norwich Gardens Ln
- 3438 Norwich Gardens Ln
- 3434 Boone Heights Ln
- 3438 Boone Heights Ln
- 3434 Norwich Gardens Ln
- 3430 Boone Heights Ln
- 3427 Norwich Gardens Ln
- 3442 Boone Heights Ln
- 3426 Boone Heights Ln
- 3430 Norwich Gardens Ln
- 3454 Norwich Gardens Ln
- 3410 Satton Ranch Ln
- 3423 Norwich Gardens Ln
- 3422 Boone Heights Ln
- 27823 Halls Farms Ln