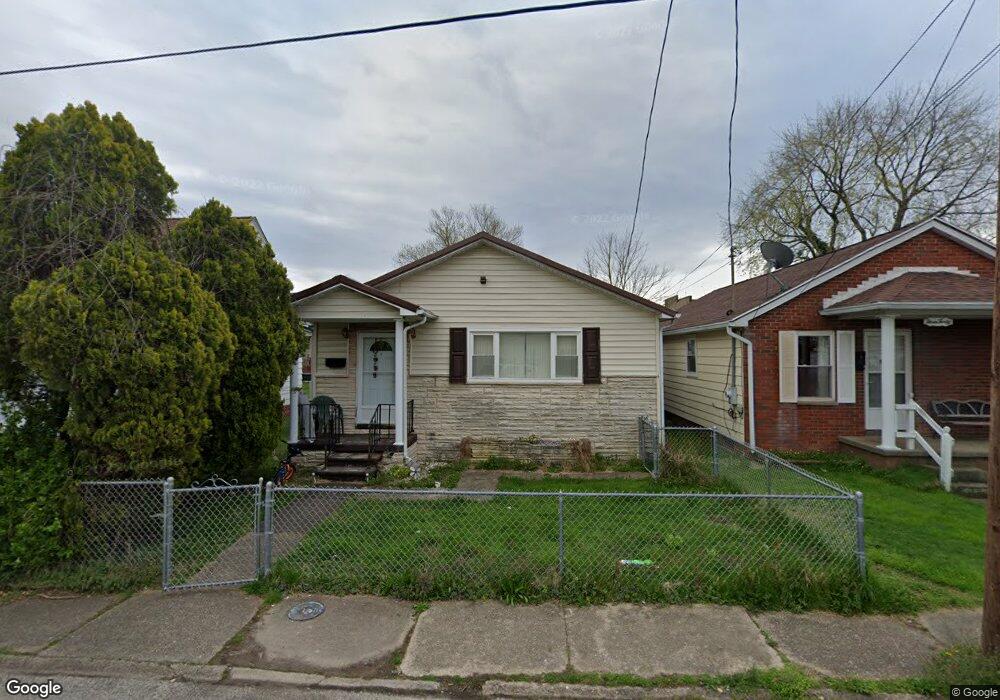
344 19th St Dunbar, WV 25064
Estimated Value: $64,000 - $136,000
3
Beds
1
Bath
839
Sq Ft
$123/Sq Ft
Est. Value
About This Home
This home is located at 344 19th St, Dunbar, WV 25064 and is currently estimated at $102,949, approximately $122 per square foot. 344 19th St is a home located in Kanawha County with nearby schools including Dunbar Primary Center, Dunbar Intermediate Center, and Dunbar Middle School.
Ownership History
Date
Name
Owned For
Owner Type
Purchase Details
Closed on
May 2, 2011
Sold by
Barnett Barbara E
Bought by
Robinson Jason W
Current Estimated Value
Home Financials for this Owner
Home Financials are based on the most recent Mortgage that was taken out on this home.
Original Mortgage
$60,268
Outstanding Balance
$41,469
Interest Rate
4.82%
Mortgage Type
VA
Estimated Equity
$61,480
Purchase Details
Closed on
Aug 10, 1999
Sold by
Page Dana K
Bought by
Barnett Oshel G
Home Financials for this Owner
Home Financials are based on the most recent Mortgage that was taken out on this home.
Original Mortgage
$53,200
Interest Rate
7.54%
Mortgage Type
Purchase Money Mortgage
Create a Home Valuation Report for This Property
The Home Valuation Report is an in-depth analysis detailing your home's value as well as a comparison with similar homes in the area
Home Values in the Area
Average Home Value in this Area
Purchase History
| Date | Buyer | Sale Price | Title Company |
|---|---|---|---|
| Robinson Jason W | $59,000 | -- | |
| Robinson Jason W | $59,000 | -- | |
| Barnett Oshel G | $56,000 | -- |
Source: Public Records
Mortgage History
| Date | Status | Borrower | Loan Amount |
|---|---|---|---|
| Open | Robinson Jason W | $60,268 | |
| Previous Owner | Barnett Oshel G | $53,200 |
Source: Public Records
Tax History
| Year | Tax Paid | Tax Assessment Tax Assessment Total Assessment is a certain percentage of the fair market value that is determined by local assessors to be the total taxable value of land and additions on the property. | Land | Improvement |
|---|---|---|---|---|
| 2025 | $667 | $40,800 | $9,360 | $31,440 |
| 2024 | $667 | $41,100 | $9,360 | $31,740 |
| 2023 | $668 | $40,860 | $9,360 | $31,500 |
| 2022 | $668 | $40,860 | $9,360 | $31,500 |
| 2021 | $668 | $40,860 | $9,360 | $31,500 |
| 2020 | $668 | $40,860 | $9,360 | $31,500 |
| 2019 | $672 | $41,100 | $9,360 | $31,740 |
| 2018 | $557 | $37,260 | $9,360 | $27,900 |
| 2017 | $558 | $37,260 | $9,360 | $27,900 |
| 2016 | $559 | $37,260 | $9,360 | $27,900 |
| 2015 | $557 | $37,260 | $9,360 | $27,900 |
| 2014 | $516 | $35,160 | $9,360 | $25,800 |
Source: Public Records
Map
Nearby Homes
- 329 18th St
- 311 20th St
- 1605 Dunbar Ave
- 1908 W Virginia Ave
- 446 22nd St
- 1515 Grosscup Ave
- 456 17th St
- 413 23rd St
- 2204 Fletcher Ave
- 538 19th St
- 532 17th St
- 1229 Payne Ave
- 2617 Dunbar Ave
- 1217 Payne Ave
- 2715 Fairlawn Ave
- 405 11th St
- 1216 Kanawha Ave
- 2211 W Virginia Ave
- 1024 W Virginia Ave
- 1003 Circle Dr