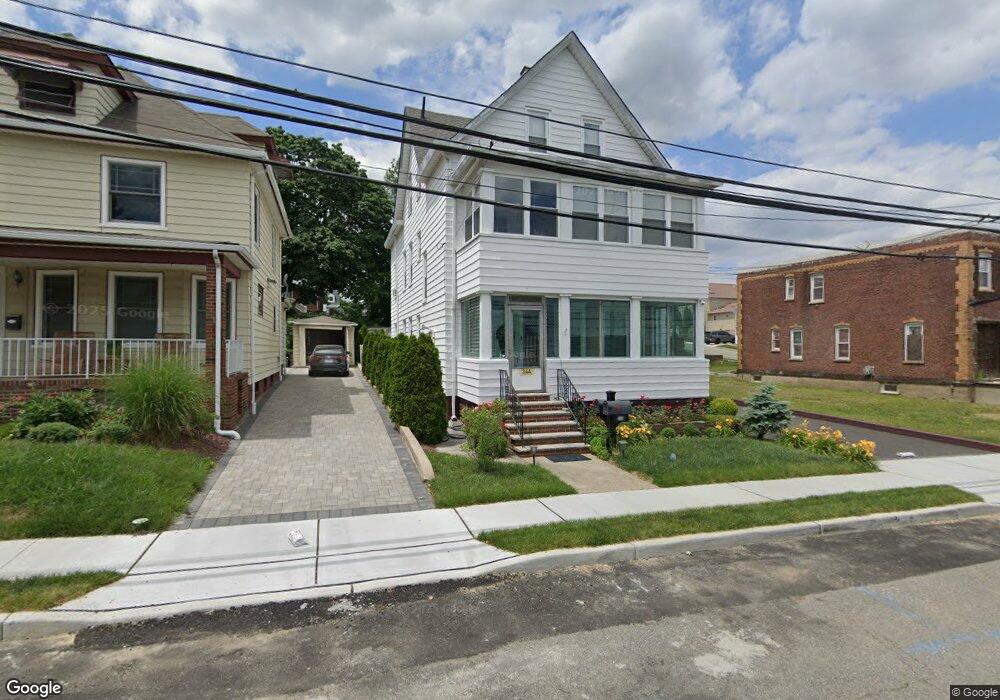
344 4th St South Amboy, NJ 08879
Estimated Value: $542,000 - $625,000
--
Bed
--
Bath
2,322
Sq Ft
$251/Sq Ft
Est. Value
About This Home
This home is located at 344 4th St, South Amboy, NJ 08879 and is currently estimated at $583,698, approximately $251 per square foot. 344 4th St is a home located in Middlesex County with nearby schools including South Amboy Elementary School, South Amboy Middle/High School, and St. Mary Elementary School.
Ownership History
Date
Name
Owned For
Owner Type
Purchase Details
Closed on
Jun 15, 2005
Sold by
Munoz Mary
Bought by
Koltun Christopher and Koltun Halina
Current Estimated Value
Home Financials for this Owner
Home Financials are based on the most recent Mortgage that was taken out on this home.
Original Mortgage
$343,200
Interest Rate
5.67%
Mortgage Type
Purchase Money Mortgage
Purchase Details
Closed on
Jan 6, 2004
Sold by
Dobrinsky Veronica
Bought by
Munoz Mary and Munoz Pedro
Home Financials for this Owner
Home Financials are based on the most recent Mortgage that was taken out on this home.
Original Mortgage
$224,000
Interest Rate
5.4%
Create a Home Valuation Report for This Property
The Home Valuation Report is an in-depth analysis detailing your home's value as well as a comparison with similar homes in the area
Home Values in the Area
Average Home Value in this Area
Purchase History
| Date | Buyer | Sale Price | Title Company |
|---|---|---|---|
| Koltun Christopher | $429,000 | -- | |
| Munoz Mary | $145,000 | -- |
Source: Public Records
Mortgage History
| Date | Status | Borrower | Loan Amount |
|---|---|---|---|
| Previous Owner | Koltun Christopher | $343,200 | |
| Previous Owner | Munoz Mary | $224,000 |
Source: Public Records
Tax History Compared to Growth
Tax History
| Year | Tax Paid | Tax Assessment Tax Assessment Total Assessment is a certain percentage of the fair market value that is determined by local assessors to be the total taxable value of land and additions on the property. | Land | Improvement |
|---|---|---|---|---|
| 2025 | $11,158 | $347,700 | $140,000 | $207,700 |
| 2024 | $10,737 | $347,700 | $140,000 | $207,700 |
| 2023 | $10,737 | $347,700 | $140,000 | $207,700 |
| 2022 | $10,202 | $347,700 | $140,000 | $207,700 |
| 2021 | $10,031 | $347,700 | $140,000 | $207,700 |
| 2020 | $9,795 | $347,700 | $140,000 | $207,700 |
| 2019 | $9,638 | $347,700 | $140,000 | $207,700 |
| 2018 | $9,558 | $347,700 | $140,000 | $207,700 |
| 2017 | $9,405 | $347,700 | $140,000 | $207,700 |
| 2016 | $9,169 | $347,700 | $140,000 | $207,700 |
| 2015 | $9,235 | $347,700 | $140,000 | $207,700 |
| 2014 | $8,919 | $347,700 | $140,000 | $207,700 |
Source: Public Records
Map
Nearby Homes
- 370 6th St
- 231 N Stevens Ave
- 518 Center St
- 326 Walnut St
- 245 2nd St
- 251 Church St
- 101 N Stevens Ave
- 428 Railroad Ave
- 498 Alpine St
- 149 Main St Unit 33
- 209 1st St
- 189 N Broadway
- 123 S Stevens Ave
- 165 2nd St
- 114 Adamecs Way Unit C114
- 504 Col Db Kelly Way
- 504 Colonel D B Kelly Way
- 109 Adamecs Way
- 322 George St
- 125 Adamecs Way Unit 26