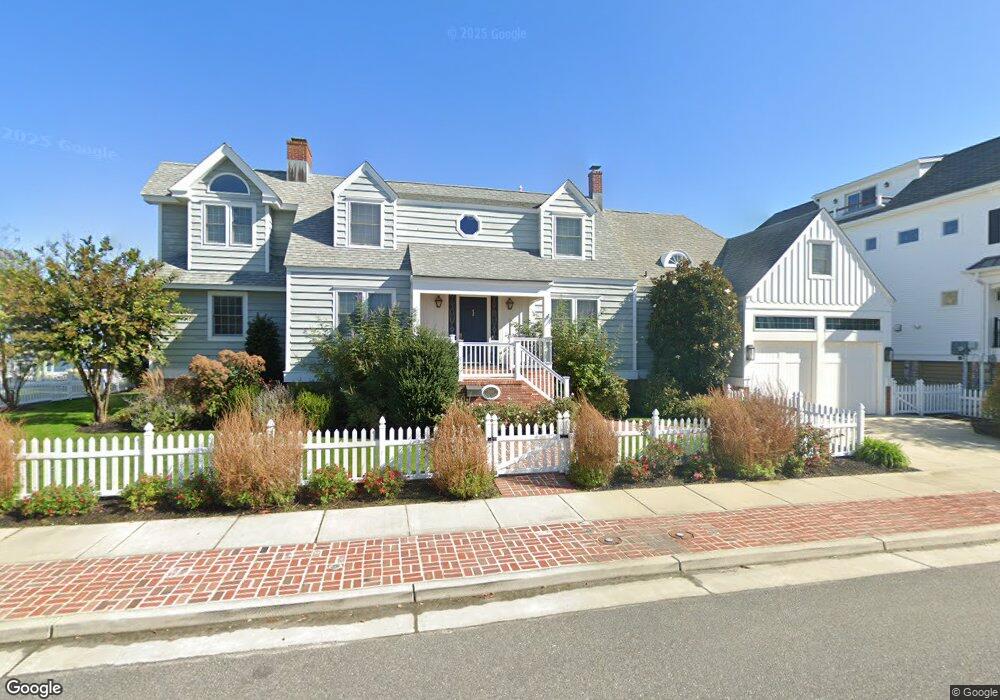
344 92nd St Stone Harbor, NJ 08247
Estimated Value: $4,467,000 - $5,628,000
--
Bed
--
Bath
3,045
Sq Ft
$1,599/Sq Ft
Est. Value
About This Home
This home is located at 344 92nd St, Stone Harbor, NJ 08247 and is currently estimated at $4,869,410, approximately $1,599 per square foot. 344 92nd St is a home located in Cape May County with nearby schools including Stone Harbor Elementary School.
Ownership History
Date
Name
Owned For
Owner Type
Purchase Details
Closed on
Dec 10, 2007
Sold by
Hardy Michael and Hardy Deborah
Bought by
Hardy Michael W and Hardy Deborah Y
Current Estimated Value
Purchase Details
Closed on
Dec 11, 1996
Sold by
Ge Capital Mtg
Bought by
Hardy Michael and Hardy Deborah
Home Financials for this Owner
Home Financials are based on the most recent Mortgage that was taken out on this home.
Original Mortgage
$400,000
Outstanding Balance
$40,843
Interest Rate
7.75%
Estimated Equity
$4,828,567
Purchase Details
Closed on
Jan 16, 1990
Sold by
State Of Nj Tidelands Resource Co
Bought by
Richardson Charles G and Richardson Frances S
Purchase Details
Closed on
Nov 14, 1988
Sold by
Moore John By Mellon Bank
Bought by
Richardson Charles and Richardson Fraces
Create a Home Valuation Report for This Property
The Home Valuation Report is an in-depth analysis detailing your home's value as well as a comparison with similar homes in the area
Home Values in the Area
Average Home Value in this Area
Purchase History
| Date | Buyer | Sale Price | Title Company |
|---|---|---|---|
| Hardy Michael W | -- | None Available | |
| Hardy Michael | $610,000 | -- | |
| Richardson Charles G | $7,200 | -- | |
| Richardson Charles | $510,000 | -- |
Source: Public Records
Mortgage History
| Date | Status | Borrower | Loan Amount |
|---|---|---|---|
| Open | Hardy Michael | $400,000 |
Source: Public Records
Tax History Compared to Growth
Tax History
| Year | Tax Paid | Tax Assessment Tax Assessment Total Assessment is a certain percentage of the fair market value that is determined by local assessors to be the total taxable value of land and additions on the property. | Land | Improvement |
|---|---|---|---|---|
| 2025 | $19,806 | $2,647,800 | $2,227,500 | $420,300 |
| 2024 | $19,806 | $2,647,800 | $2,227,500 | $420,300 |
| 2023 | $19,461 | $2,647,800 | $2,227,500 | $420,300 |
| 2022 | $18,323 | $2,647,800 | $2,227,500 | $420,300 |
| 2021 | $12,723 | $2,647,800 | $2,227,500 | $420,300 |
| 2020 | $16,152 | $2,647,800 | $2,227,500 | $420,300 |
| 2019 | $15,172 | $2,647,800 | $2,227,500 | $420,300 |
| 2018 | $14,616 | $2,647,800 | $2,227,500 | $420,300 |
| 2017 | $15,552 | $2,802,100 | $2,475,000 | $327,100 |
| 2016 | $14,991 | $2,802,100 | $2,475,000 | $327,100 |
| 2015 | $14,711 | $2,802,100 | $2,475,000 | $327,100 |
| 2014 | $14,515 | $2,802,100 | $2,475,000 | $327,100 |
Source: Public Records
Map
Nearby Homes