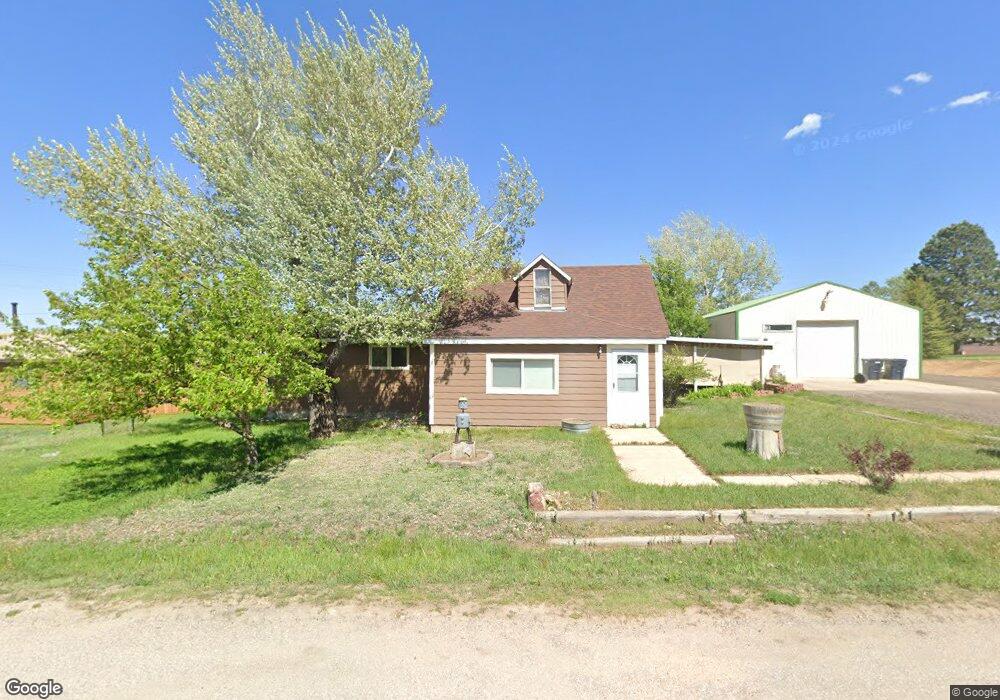
344 Boulder St Calhan, CO 80808
Estimated Value: $301,932 - $379,000
2
Beds
2
Baths
1,517
Sq Ft
$222/Sq Ft
Est. Value
About This Home
This home is located at 344 Boulder St, Calhan, CO 80808 and is currently estimated at $336,733, approximately $221 per square foot. 344 Boulder St is a home located in El Paso County with nearby schools including Calhan Elementary School, Calhan Middle School, and Calhan Secondary School.
Ownership History
Date
Name
Owned For
Owner Type
Purchase Details
Closed on
Mar 12, 2024
Sold by
Bartling Blair E and Bartling Jeanette I
Bought by
Blair Bartling And Jeanette Bartling Revocabl
Current Estimated Value
Purchase Details
Closed on
Jan 5, 1996
Sold by
Stephany Dean Joseph and Stephany Pamela Sue
Bought by
Bartling Blair E and Bartling Jeanette I
Home Financials for this Owner
Home Financials are based on the most recent Mortgage that was taken out on this home.
Original Mortgage
$87,321
Interest Rate
7.31%
Mortgage Type
FHA
Purchase Details
Closed on
Aug 20, 1993
Bought by
Bartling Blair E and Bartling Jeanette I
Purchase Details
Closed on
Jun 23, 1992
Bought by
Bartling Blair E and Bartling Jeanette I
Purchase Details
Closed on
Nov 15, 1983
Bought by
Bartling Blair E and Bartling Jeanette I
Purchase Details
Closed on
Nov 14, 1977
Bought by
Bartling Blair E and Bartling Jeanette I
Create a Home Valuation Report for This Property
The Home Valuation Report is an in-depth analysis detailing your home's value as well as a comparison with similar homes in the area
Home Values in the Area
Average Home Value in this Area
Purchase History
| Date | Buyer | Sale Price | Title Company |
|---|---|---|---|
| Blair Bartling And Jeanette Bartling Revocabl | -- | None Listed On Document | |
| Bartling Blair E | $88,000 | Unified Title Co Inc | |
| Bartling Blair E | $69,000 | -- | |
| Bartling Blair E | $60,000 | -- | |
| Bartling Blair E | -- | -- | |
| Bartling Blair E | -- | -- |
Source: Public Records
Mortgage History
| Date | Status | Borrower | Loan Amount |
|---|---|---|---|
| Previous Owner | Bartling Blair E | $87,321 |
Source: Public Records
Tax History Compared to Growth
Tax History
| Year | Tax Paid | Tax Assessment Tax Assessment Total Assessment is a certain percentage of the fair market value that is determined by local assessors to be the total taxable value of land and additions on the property. | Land | Improvement |
|---|---|---|---|---|
| 2025 | $1,298 | $22,570 | -- | -- |
| 2024 | $1,194 | $20,900 | $3,920 | $16,980 |
| 2023 | $1,194 | $20,900 | $3,920 | $16,980 |
| 2022 | $861 | $11,260 | $2,710 | $8,550 |
| 2021 | $790 | $11,590 | $2,790 | $8,800 |
| 2020 | $676 | $9,750 | $1,860 | $7,890 |
| 2019 | $607 | $9,750 | $1,860 | $7,890 |
| 2018 | $546 | $8,580 | $1,870 | $6,710 |
| 2017 | $540 | $8,580 | $1,870 | $6,710 |
| 2016 | $533 | $8,460 | $1,970 | $6,490 |
| 2015 | $533 | $8,460 | $1,970 | $6,490 |
| 2014 | $508 | $7,990 | $1,970 | $6,020 |
Source: Public Records
Map
Nearby Homes
- 344 3rd St
- 401 Cheyenne St
- 495 Golden St
- Floresta Plan at Mayberry Village
- Woodlyn Plan at Mayberry Village
- Roseland Plan at Mayberry Village
- Aster Plan at Mayberry Village
- Havenwood Plan at Mayberry Village
- Beacon Plan at Mayberry Village
- Terramar Plan at Mayberry Village
- Bristol Plan at Mayberry Village
- 0000 Judge Orr Rd
- 1049 Denver St
- 1075 8th St
- 1120 Monument St
- 11040 N Calhan Hwy
- 15530 Kanuch Rd
- 12275 N Calhan Hwy
- 29440 Gardetto View
- 26155 Sweet Rd