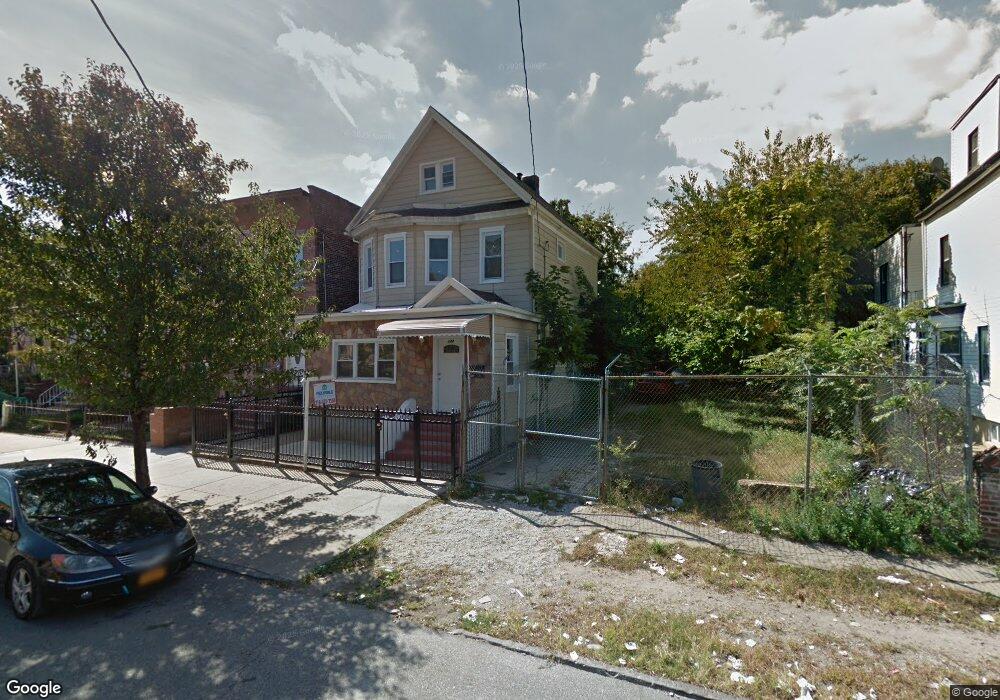
344 Bradford St Brooklyn, NY 11207
East New York NeighborhoodEstimated Value: $695,289 - $1,122,000
Studio
--
Bath
2,048
Sq Ft
$469/Sq Ft
Est. Value
About This Home
This home is located at 344 Bradford St, Brooklyn, NY 11207 and is currently estimated at $961,072, approximately $469 per square foot. 344 Bradford St is a home located in Kings County with nearby schools including P.S. 149 Danny Kaye, J.H.S 292 Margaret S. Douglas, and Hyde Leadership Charter School-Brooklyn.
Ownership History
Date
Name
Owned For
Owner Type
Purchase Details
Closed on
Dec 11, 2013
Sold by
Rugaza Acquisitons Inc
Bought by
Soto Areli and Soto Sunami
Current Estimated Value
Home Financials for this Owner
Home Financials are based on the most recent Mortgage that was taken out on this home.
Original Mortgage
$530,219
Outstanding Balance
$396,086
Interest Rate
4.35%
Mortgage Type
Commercial
Estimated Equity
$564,986
Purchase Details
Closed on
May 12, 2013
Sold by
Mula Group Inc
Bought by
Rugaza Acquisitions Inc
Home Financials for this Owner
Home Financials are based on the most recent Mortgage that was taken out on this home.
Original Mortgage
$200,000
Interest Rate
3.45%
Mortgage Type
New Conventional
Purchase Details
Closed on
Apr 12, 2013
Sold by
Goulbourne Howard Anthony
Bought by
Mula Group Inc
Home Financials for this Owner
Home Financials are based on the most recent Mortgage that was taken out on this home.
Original Mortgage
$200,000
Interest Rate
3.45%
Mortgage Type
New Conventional
Purchase Details
Closed on
Jun 2, 2009
Sold by
Better Marketing Realty Llc
Bought by
Goulbourne Howard Anthony
Home Financials for this Owner
Home Financials are based on the most recent Mortgage that was taken out on this home.
Original Mortgage
$452,000
Interest Rate
4.86%
Mortgage Type
Purchase Money Mortgage
Purchase Details
Closed on
May 29, 2009
Sold by
Grp Loan Llc
Bought by
Better Marketing Realty Llc
Home Financials for this Owner
Home Financials are based on the most recent Mortgage that was taken out on this home.
Original Mortgage
$452,000
Interest Rate
4.86%
Mortgage Type
Purchase Money Mortgage
Purchase Details
Closed on
Jun 9, 2007
Sold by
Mackey Jr William F Esq
Bought by
Grp Loan Llc
Purchase Details
Closed on
Mar 11, 2005
Sold by
Verasami Edwin
Bought by
Richardson Evelyn
Home Financials for this Owner
Home Financials are based on the most recent Mortgage that was taken out on this home.
Original Mortgage
$75,000
Interest Rate
5.56%
Purchase Details
Closed on
Oct 12, 2004
Sold by
Shibush Llc
Bought by
Verasami Edwin
Purchase Details
Closed on
Sep 6, 2002
Sold by
Quinones Phyllis Thomas
Bought by
Shibush Llc
Purchase Details
Closed on
Mar 19, 1998
Sold by
Williams Lee F
Bought by
Quinones Phyllis D Thomas
Create a Home Valuation Report for This Property
The Home Valuation Report is an in-depth analysis detailing your home's value as well as a comparison with similar homes in the area
Home Values in the Area
Average Home Value in this Area
Purchase History
| Date | Buyer | Sale Price | Title Company |
|---|---|---|---|
| Soto Areli | $540,000 | -- | |
| Soto Areli | $540,000 | -- | |
| Rugaza Acquisitions Inc | -- | -- | |
| Rugaza Acquisitions Inc | -- | -- | |
| Mula Group Inc | $150,000 | -- | |
| Mula Group Inc | $150,000 | -- | |
| Goulbourne Howard Anthony | -- | -- | |
| Goulbourne Howard Anthony | -- | -- | |
| Better Marketing Realty Llc | $260,000 | -- | |
| Better Marketing Realty Llc | $260,000 | -- | |
| Grp Loan Llc | $1,000 | -- | |
| Grp Loan Llc | $1,000 | -- | |
| Richardson Evelyn | $375,000 | -- | |
| Richardson Evelyn | $375,000 | -- | |
| Verasami Edwin | $254,480 | -- | |
| Verasami Edwin | $254,480 | -- | |
| Shibush Llc | -- | -- | |
| Shibush Llc | -- | -- | |
| Quinones Phyllis D Thomas | -- | -- | |
| Quinones Phyllis D Thomas | -- | -- |
Source: Public Records
Mortgage History
| Date | Status | Borrower | Loan Amount |
|---|---|---|---|
| Open | Soto Areli | $530,219 | |
| Closed | Soto Areli | $530,219 | |
| Previous Owner | Mula Group Inc | $200,000 | |
| Previous Owner | Goulbourne Howard Anthony | $452,000 | |
| Previous Owner | Richardson Evelyn | $75,000 | |
| Previous Owner | Richardson Evelyn | $300,000 |
Source: Public Records
Tax History
| Year | Tax Paid | Tax Assessment Tax Assessment Total Assessment is a certain percentage of the fair market value that is determined by local assessors to be the total taxable value of land and additions on the property. | Land | Improvement |
|---|---|---|---|---|
| 2025 | $5,249 | $53,340 | $21,600 | $31,740 |
| 2024 | $5,249 | $59,160 | $21,600 | $37,560 |
| 2023 | $5,073 | $52,260 | $21,600 | $30,660 |
| 2022 | $4,770 | $52,260 | $21,600 | $30,660 |
| 2021 | $4,812 | $53,220 | $21,600 | $31,620 |
| 2020 | $2,391 | $46,980 | $21,600 | $25,380 |
| 2019 | $4,556 | $49,260 | $21,600 | $27,660 |
| 2018 | $4,244 | $20,817 | $11,783 | $9,034 |
| 2017 | $4,059 | $19,910 | $13,945 | $5,965 |
| 2016 | $3,809 | $19,053 | $11,337 | $7,716 |
| 2015 | $1,504 | $19,045 | $9,936 | $9,109 |
| 2014 | $1,504 | $14,180 | $8,134 | $6,046 |
Source: Public Records
Map
Nearby Homes
- 334 Bradford St
- 342 Wyona St
- 395 Vermont St
- 440 Miller Ave
- 443 Miller Ave
- 412 Bradford St
- 461 Miller Ave
- 439 Vermont St
- 392 New Jersey Ave Unit 3921
- 412 Hendrix St
- 317 Pennsylvania Ave
- 243 Wyona St
- 444 New Jersey Ave
- 563 Belmont Ave
- 446 New Jersey Ave
- 353 Pennsylvania Ave
- 279 van Siclen Ave
- 537 Miller Ave
- 359 Sheffield Ave
- 396 Barbey St
- 346 Bradford St
- 340 Bradford St
- 348 Bradford St
- 338 Bradford St
- 350 Bradford St
- 352 Bradford St
- 354 Bradford St Unit 1
- 354 Bradford St
- 339 Wyona St
- 341 Wyona St
- 337 Wyona St
- 335 Wyona St
- 335 Wyona St Unit 2
- 335 Wyona St Unit 1
- 335 Wyona St Unit none
- 343 Wyona St
- 345 Wyona St
- 333 Wyona St
- 332 Bradford St
- 356 Bradford St
Your Personal Tour Guide
Ask me questions while you tour the home.