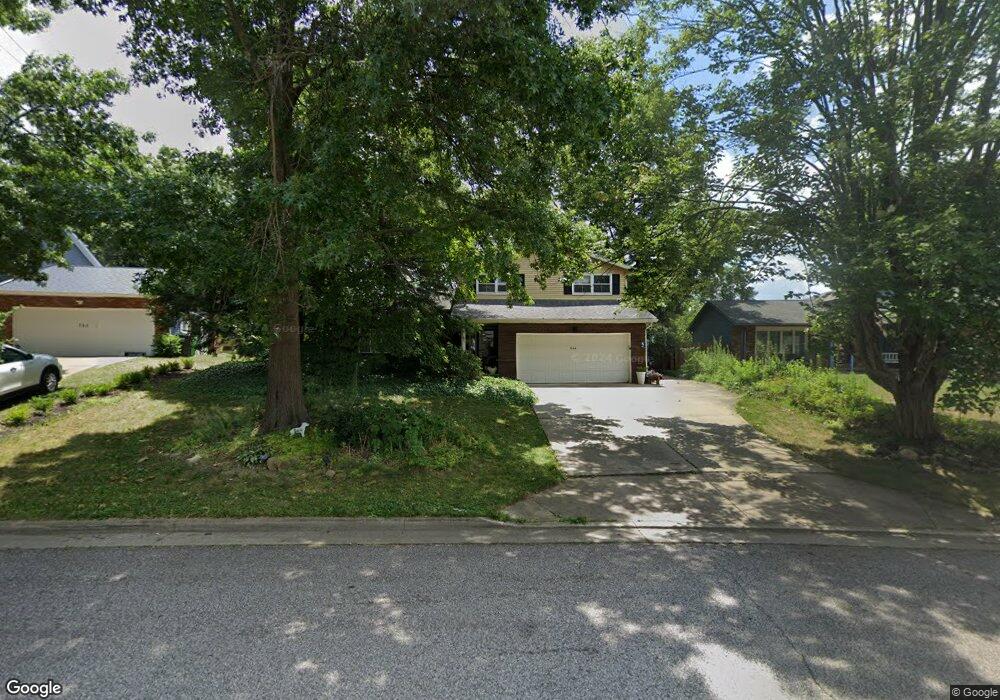
344 Castleton Rd NE North Canton, OH 44720
Estimated Value: $223,000 - $284,000
3
Beds
3
Baths
2,136
Sq Ft
$118/Sq Ft
Est. Value
About This Home
This home is located at 344 Castleton Rd NE, North Canton, OH 44720 and is currently estimated at $252,234, approximately $118 per square foot. 344 Castleton Rd NE is a home located in Stark County with nearby schools including North Canton Middle School, Hoover High School, and St Paul School.
Ownership History
Date
Name
Owned For
Owner Type
Purchase Details
Closed on
Aug 23, 2019
Sold by
Williams Craig H J
Bought by
Wiliams Holly A
Current Estimated Value
Home Financials for this Owner
Home Financials are based on the most recent Mortgage that was taken out on this home.
Original Mortgage
$161,500
Outstanding Balance
$141,444
Interest Rate
3.7%
Mortgage Type
New Conventional
Estimated Equity
$110,790
Purchase Details
Closed on
Feb 15, 2001
Sold by
Williams Beverly J and Williams Roger W
Bought by
Williams Roger W and Williams Beverly J
Purchase Details
Closed on
Feb 7, 2000
Sold by
Williams Beverly J and Williams Roger W
Bought by
Williams Roger W and Williams Beverly J
Create a Home Valuation Report for This Property
The Home Valuation Report is an in-depth analysis detailing your home's value as well as a comparison with similar homes in the area
Home Values in the Area
Average Home Value in this Area
Purchase History
| Date | Buyer | Sale Price | Title Company |
|---|---|---|---|
| Wiliams Holly A | $55,500 | Prescott Revere Land Title | |
| Williams Holly A | $55,500 | Prescott Revere Land Title | |
| Williams Holly A | $55,500 | Prescott Revere Land Title | |
| Williams Roger W | -- | -- | |
| Williams Roger W | -- | -- |
Source: Public Records
Mortgage History
| Date | Status | Borrower | Loan Amount |
|---|---|---|---|
| Open | Wiliams Holly A | $161,500 |
Source: Public Records
Tax History Compared to Growth
Tax History
| Year | Tax Paid | Tax Assessment Tax Assessment Total Assessment is a certain percentage of the fair market value that is determined by local assessors to be the total taxable value of land and additions on the property. | Land | Improvement |
|---|---|---|---|---|
| 2025 | -- | $83,660 | $15,160 | $68,500 |
| 2024 | -- | $83,660 | $15,160 | $68,500 |
| 2023 | $3,157 | $59,020 | $10,820 | $48,200 |
| 2022 | $3,034 | $59,020 | $10,820 | $48,200 |
| 2021 | $2,926 | $59,020 | $10,820 | $48,200 |
| 2020 | $2,849 | $51,600 | $9,420 | $42,180 |
| 2019 | $2,209 | $51,600 | $9,420 | $42,180 |
| 2018 | $2,290 | $51,600 | $9,420 | $42,180 |
| 2017 | $1,994 | $47,920 | $8,300 | $39,620 |
| 2016 | $2,001 | $47,920 | $8,300 | $39,620 |
| 2015 | $453 | $47,920 | $8,300 | $39,620 |
| 2014 | $1,879 | $42,950 | $7,460 | $35,490 |
| 2013 | $215 | $42,950 | $7,460 | $35,490 |
Source: Public Records
Map
Nearby Homes
- 1060 Park Ave NE
- 1350 Overland Ave NE
- 434 Heather Cir NE
- 807 N Main St
- 945 Royal Oak Ave NE
- 870 Honeysuckle Cir NE
- 140 5th St NE
- 1263 Los Angeles Blvd NW
- 825 6th St NE
- 404 7th St NW
- 2684 Fordham Cir NW
- 1020 Pickforde Dr NE
- 360 Woodside Ave NE
- 455 Royer Ave NW
- 2677 Radford St NW
- 2774 Bridlewood St NW
- 406 Hower St NE
- 448 Hower St NE
- 608 Werstler Ave NW
- 1240 7th St NE
- 338 Castleton Rd NE
- 350 Castleton Rd NE
- 421 Holl Rd NE
- 427 Holl Rd NE
- 332 Castleton Rd NE
- 413 Holl Rd NE
- 404 Chapple Hill Dr NE
- 435 Holl Rd NE
- 341 Castleton Rd NE
- 410 Chapple Hill Dr NE
- 407 Holl Rd NE
- 324 Castleton Rd NE
- 418 Chapple Hill Dr NE
- 333 Castleton Rd NE
- 401 Holl Rd NE
- 352 Chapple Hill Dr NE
- 511 Holl Rd NE
- 426 Holl Rd NE
- 325 Castleton Rd NE
- 316 Castleton Rd NE