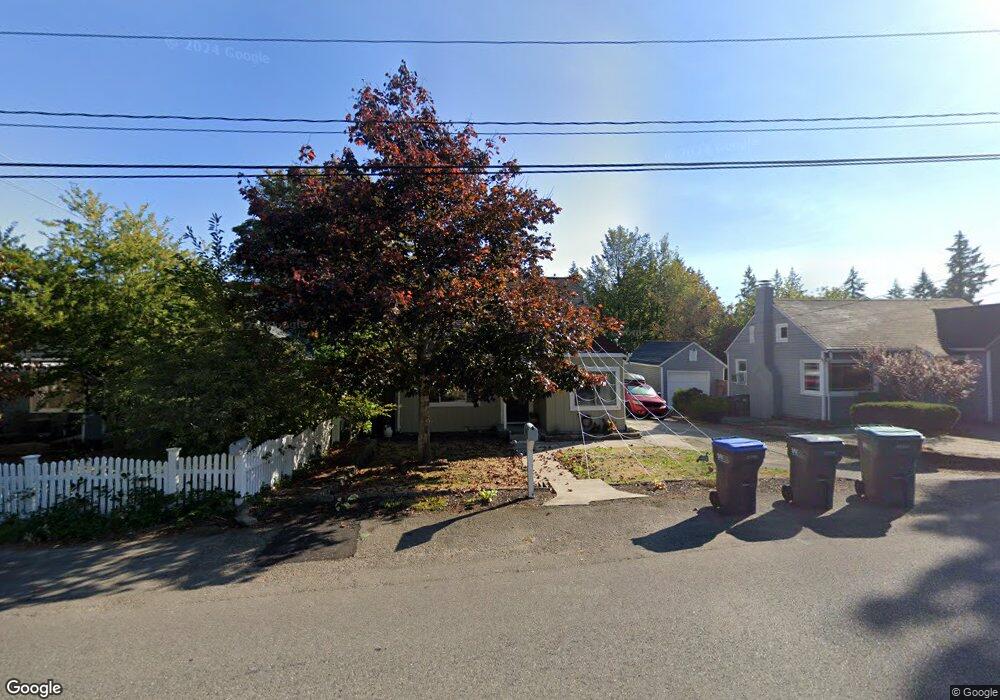
344 Dora Ave Bremerton, WA 98312
Charleston NeighborhoodEstimated Value: $402,992 - $496,000
3
Beds
1
Bath
1,244
Sq Ft
$347/Sq Ft
Est. Value
About This Home
This home is located at 344 Dora Ave, Bremerton, WA 98312 and is currently estimated at $431,998, approximately $347 per square foot. 344 Dora Ave is a home located in Kitsap County with nearby schools including West Hills S.T.E.M. Academy, Mountain View Middle School, and Bremerton High School.
Ownership History
Date
Name
Owned For
Owner Type
Purchase Details
Closed on
Nov 22, 2021
Sold by
Rhoden Lee Ann and Pleasant Lee Ann
Bought by
Rhoden Lee Ann and Wylde Christine R
Current Estimated Value
Home Financials for this Owner
Home Financials are based on the most recent Mortgage that was taken out on this home.
Original Mortgage
$160,000
Outstanding Balance
$146,734
Interest Rate
3.05%
Mortgage Type
New Conventional
Estimated Equity
$285,264
Purchase Details
Closed on
Aug 3, 2018
Sold by
Post Megan
Bought by
Rhoden Lee Ann
Purchase Details
Closed on
Jul 17, 2000
Sold by
Sweet Jerome D and Sweet Linda
Bought by
Martin John D and Martin Tanna J
Home Financials for this Owner
Home Financials are based on the most recent Mortgage that was taken out on this home.
Original Mortgage
$88,778
Interest Rate
8.37%
Mortgage Type
FHA
Purchase Details
Closed on
Nov 3, 1997
Sold by
Sweet Terri Lee and Rainey Roy A H
Bought by
Sweet Jerome D
Create a Home Valuation Report for This Property
The Home Valuation Report is an in-depth analysis detailing your home's value as well as a comparison with similar homes in the area
Home Values in the Area
Average Home Value in this Area
Purchase History
| Date | Buyer | Sale Price | Title Company |
|---|---|---|---|
| Rhoden Lee Ann | -- | Aegis Land Title Group | |
| Rhoden Lee Ann | -- | Accommodation | |
| Martin John D | $89,950 | Land Title Company | |
| Sweet Jerome D | -- | -- |
Source: Public Records
Mortgage History
| Date | Status | Borrower | Loan Amount |
|---|---|---|---|
| Open | Rhoden Lee Ann | $160,000 | |
| Previous Owner | Martin John D | $88,778 | |
| Closed | Martin John D | $5,000 |
Source: Public Records
Tax History Compared to Growth
Tax History
| Year | Tax Paid | Tax Assessment Tax Assessment Total Assessment is a certain percentage of the fair market value that is determined by local assessors to be the total taxable value of land and additions on the property. | Land | Improvement |
|---|---|---|---|---|
| 2026 | $3,354 | $380,220 | $78,260 | $301,960 |
| 2025 | $3,354 | $380,220 | $78,260 | $301,960 |
| 2024 | $3,237 | $380,220 | $78,260 | $301,960 |
| 2023 | $3,346 | $380,220 | $78,260 | $301,960 |
| 2022 | $3,119 | $318,710 | $65,220 | $253,490 |
| 2021 | $2,836 | $265,220 | $49,270 | $215,950 |
| 2020 | $2,641 | $246,780 | $45,590 | $201,190 |
| 2019 | $2,288 | $221,460 | $40,700 | $180,760 |
| 2018 | $2,373 | $151,410 | $30,600 | $120,810 |
| 2017 | $1,983 | $151,410 | $30,600 | $120,810 |
| 2016 | $1,851 | $133,780 | $26,840 | $106,940 |
| 2015 | $1,838 | $132,160 | $29,190 | $102,970 |
| 2014 | -- | $126,350 | $29,190 | $97,160 |
| 2013 | -- | $134,740 | $30,810 | $103,930 |
Source: Public Records
Map
Nearby Homes
- 347 Dora Ave
- 500 N National Ave Unit 37
- 2613 Burwell St
- 931 Oyster Bay Ct
- 921 Pershing Ave Unit 203
- 923 Pershing Ave Unit 205
- 1 XXXX 1st St
- 122 National Ave S
- 1135 Morgan Rd NW Unit A & B
- 1309 Times Ave
- 1303 Times Ave
- 320 N Lafayette Ave
- 106 Mcneal Ave
- 179 Russell Rd N
- 231 S Yantic Ave
- 4532 Abalone St
- 0 S Hartford Ave
- 114 S Lafayette Ave
- 205 S Summit Ave
- 232 S Yantic Ave