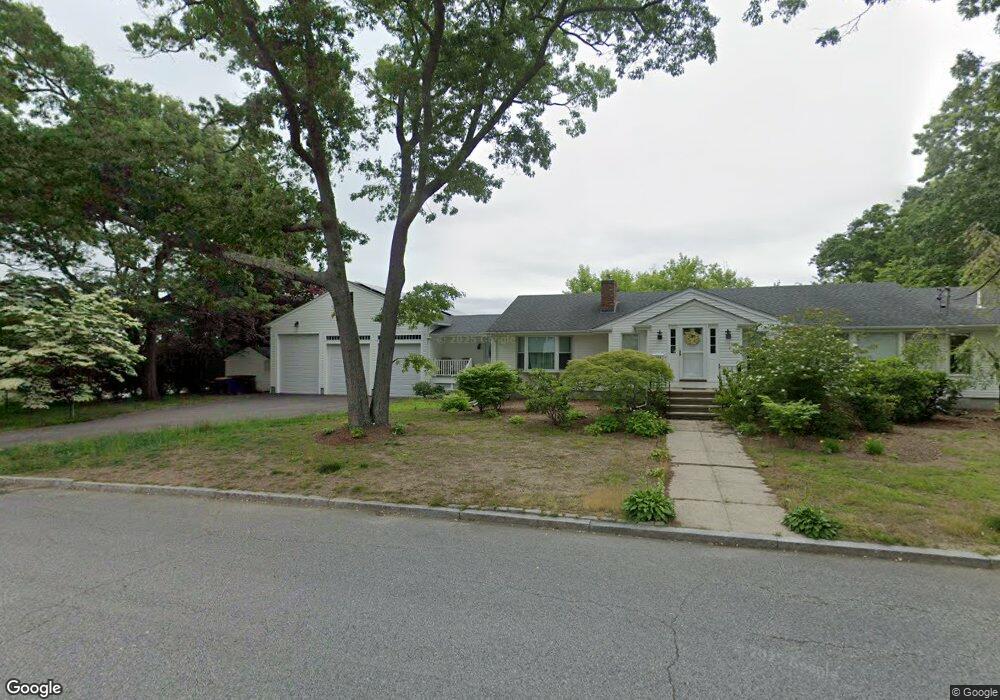
344 Dunbar St Fall River, MA 02723
Bank Street NeighborhoodEstimated Value: $493,000 - $696,000
3
Beds
3
Baths
2,384
Sq Ft
$255/Sq Ft
Est. Value
About This Home
This home is located at 344 Dunbar St, Fall River, MA 02723 and is currently estimated at $607,746, approximately $254 per square foot. 344 Dunbar St is a home located in Bristol County with nearby schools including Mary Fonseca Elementary School, Talbot Innovation School, and B M C Durfee High School.
Ownership History
Date
Name
Owned For
Owner Type
Purchase Details
Closed on
Nov 24, 2009
Sold by
Khoury Peter Charles
Bought by
Montleon Marta E and Montleon Edward R
Current Estimated Value
Home Financials for this Owner
Home Financials are based on the most recent Mortgage that was taken out on this home.
Original Mortgage
$240,000
Outstanding Balance
$156,220
Interest Rate
4.86%
Mortgage Type
Purchase Money Mortgage
Estimated Equity
$451,526
Create a Home Valuation Report for This Property
The Home Valuation Report is an in-depth analysis detailing your home's value as well as a comparison with similar homes in the area
Home Values in the Area
Average Home Value in this Area
Purchase History
| Date | Buyer | Sale Price | Title Company |
|---|---|---|---|
| Montleon Marta E | $325,000 | -- |
Source: Public Records
Mortgage History
| Date | Status | Borrower | Loan Amount |
|---|---|---|---|
| Open | Montleon Marta E | $240,000 |
Source: Public Records
Tax History Compared to Growth
Tax History
| Year | Tax Paid | Tax Assessment Tax Assessment Total Assessment is a certain percentage of the fair market value that is determined by local assessors to be the total taxable value of land and additions on the property. | Land | Improvement |
|---|---|---|---|---|
| 2025 | $6,356 | $555,100 | $158,200 | $396,900 |
| 2024 | $5,927 | $515,800 | $152,100 | $363,700 |
| 2023 | $5,940 | $484,100 | $136,500 | $347,600 |
| 2022 | $5,220 | $413,600 | $126,400 | $287,200 |
| 2021 | $5,261 | $380,400 | $119,400 | $261,000 |
| 2020 | $5,058 | $350,000 | $114,900 | $235,100 |
| 2019 | $4,883 | $334,900 | $114,900 | $220,000 |
| 2018 | $4,775 | $326,600 | $114,900 | $211,700 |
| 2017 | $4,526 | $323,300 | $114,900 | $208,400 |
| 2016 | $4,280 | $314,000 | $114,900 | $199,100 |
| 2015 | $4,085 | $312,300 | $107,500 | $204,800 |
| 2014 | $3,929 | $312,300 | $107,500 | $204,800 |
Source: Public Records
Map
Nearby Homes
- 44 Fenmore St
- 168 Windsor St
- 1796 Locust St
- 200 David St
- 235 Chavenson St
- 243 Oak Grove Ave
- 302 Oak Grove Ave
- 344 Beattie St Unit 5
- 380 Eddy St
- 350 Doherty St
- 36 Fordney St
- 14 Downing St
- 23 Lexington St
- 159 Covel St
- 89 Lafayette St
- 85 Reney St
- 83 Jencks St
- 34 Quequechan St
- 32 Quequechan St
- 88 Harrison St Unit 5