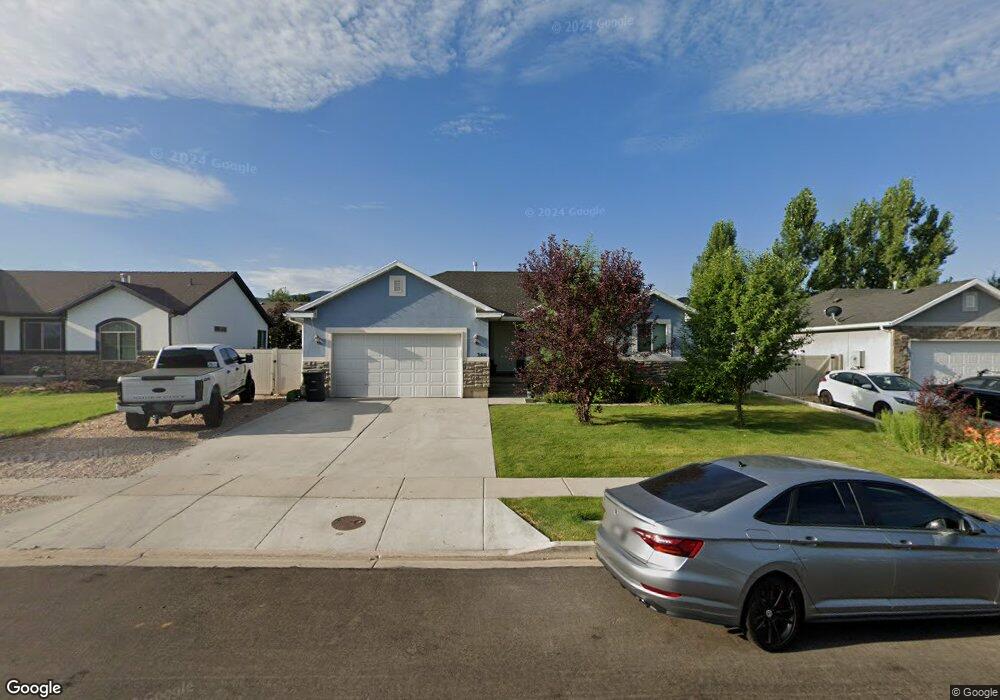
344 E 2200 So Heber City, UT 84032
Estimated Value: $711,000 - $808,000
--
Bed
--
Bath
1,289
Sq Ft
$592/Sq Ft
Est. Value
About This Home
This home is located at 344 E 2200 So, Heber City, UT 84032 and is currently estimated at $762,832, approximately $591 per square foot. 344 E 2200 So is a home located in Wasatch County with nearby schools including Daniels Canyon Elementary School, Wasatch High School, and Soldier Hollow Charter School.
Ownership History
Date
Name
Owned For
Owner Type
Purchase Details
Closed on
Nov 11, 2014
Sold by
Compass Point Construction Llc
Bought by
Hansen Todd E and Hansen Makenzie M
Current Estimated Value
Home Financials for this Owner
Home Financials are based on the most recent Mortgage that was taken out on this home.
Original Mortgage
$228,189
Outstanding Balance
$175,826
Interest Rate
4.16%
Mortgage Type
New Conventional
Estimated Equity
$587,006
Purchase Details
Closed on
Jul 23, 2014
Sold by
Fantin James J
Bought by
Compass Point Construction Lc
Home Financials for this Owner
Home Financials are based on the most recent Mortgage that was taken out on this home.
Original Mortgage
$165,539
Interest Rate
4.11%
Mortgage Type
Unknown
Purchase Details
Closed on
Feb 19, 2009
Sold by
Desert Point Builders Inc and Fantin Jim
Bought by
Fantin James J
Create a Home Valuation Report for This Property
The Home Valuation Report is an in-depth analysis detailing your home's value as well as a comparison with similar homes in the area
Home Values in the Area
Average Home Value in this Area
Purchase History
| Date | Buyer | Sale Price | Title Company |
|---|---|---|---|
| Hansen Todd E | -- | Artisan Title | |
| Compass Point Construction Lc | -- | Artisan Title | |
| Fantin James J | $1,040,000 | Etitle Insurance Agency |
Source: Public Records
Mortgage History
| Date | Status | Borrower | Loan Amount |
|---|---|---|---|
| Open | Hansen Todd E | $228,189 | |
| Previous Owner | Compass Point Construction Lc | $165,539 |
Source: Public Records
Tax History Compared to Growth
Tax History
| Year | Tax Paid | Tax Assessment Tax Assessment Total Assessment is a certain percentage of the fair market value that is determined by local assessors to be the total taxable value of land and additions on the property. | Land | Improvement |
|---|---|---|---|---|
| 2025 | $3,175 | $662,220 | $240,000 | $422,220 |
| 2024 | $3,175 | $624,015 | $240,000 | $384,015 |
| 2023 | $3,175 | $560,340 | $150,000 | $410,340 |
| 2022 | $3,118 | $560,340 | $150,000 | $410,340 |
| 2021 | $2,676 | $382,050 | $125,080 | $256,970 |
| 2020 | $2,458 | $341,694 | $125,080 | $216,614 |
| 2019 | $2,329 | $187,932 | $0 | $0 |
| 2018 | $2,163 | $174,523 | $0 | $0 |
| 2017 | $1,888 | $151,532 | $0 | $0 |
| 2016 | $1,798 | $140,532 | $0 | $0 |
| 2015 | $1,715 | $140,532 | $0 | $0 |
| 2014 | $677 | $60,000 | $60,000 | $0 |
Source: Public Records
Map
Nearby Homes
- 327 E 2260 S
- 2280 S 330 E
- 2185 S 150 E
- 488 E Acord Way
- 2071 S 500 E
- 2029 S 150 E
- 2586 E Water Wheel Ct
- 114 Mountain Valley Ct
- 2520 S 260 E
- 175 E 1985 S
- 2403 S Orchard Cir E Unit 11
- 2444 S Orchard Cir E Unit 5
- 74 Horizon Ave
- 1922 S Highway 40 Unit 3
- 1922 S Highway 40 Unit 2
- 1922 S Highway 40 Unit 39
- 1922 S Highway 40 Unit 38
- 1922 S Highway 40 Unit 37
- 1922 S Highway 40 Unit 36
- 12 Skyline Dr
- 344 E 2200 S
- 344 E 2200 S Unit 48
- 360 E 2200 S
- 326 E 2200 So
- 326 E 2200 S
- 326 E 2200 S
- 326 E 2200 S Unit 47
- 345 E 2260 S
- 345 E 2260 So
- 327 E 2260 So
- 312 E 2200 S
- 363 E 2260 S
- 380 E 2200 S
- 341 E 2200 S
- 357 E 2200 S Unit 25
- 313 E 2260 S
- 0 2400 East 2200 S
- 385 E 2260 S
- 325 E 2200 S Unit 27
- 325 E 2200 S