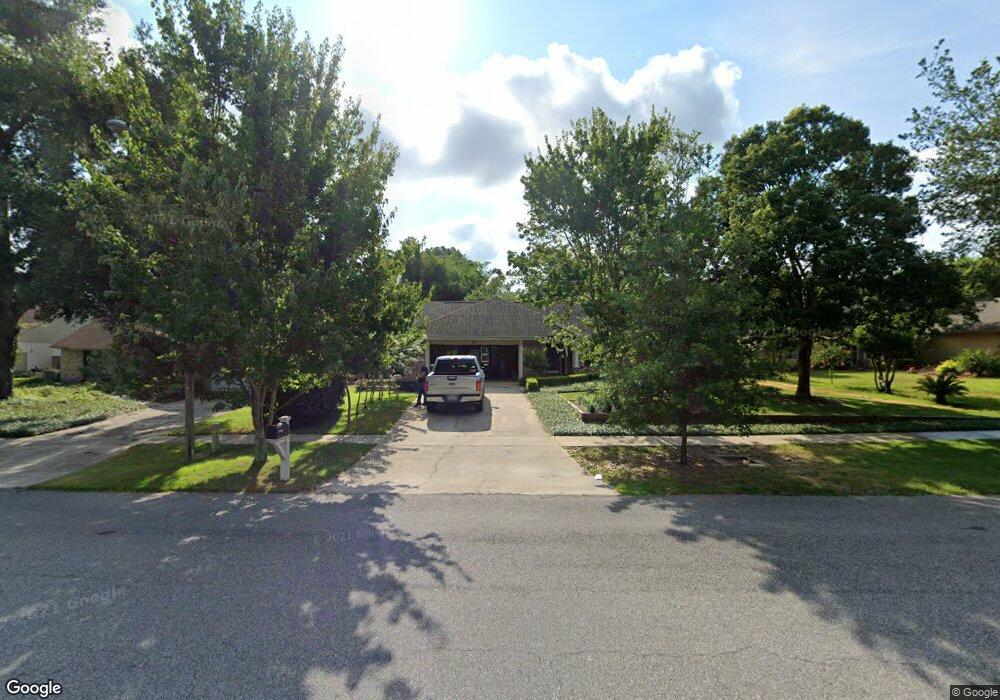
344 Haverlake Cir Apopka, FL 32712
Estimated Value: $382,000 - $424,000
3
Beds
2
Baths
2,522
Sq Ft
$158/Sq Ft
Est. Value
About This Home
This home is located at 344 Haverlake Cir, Apopka, FL 32712 and is currently estimated at $399,148, approximately $158 per square foot. 344 Haverlake Cir is a home located in Orange County with nearby schools including Clay Springs Elementary School, Piedmont Lakes Middle School, and Wekiva High School.
Ownership History
Date
Name
Owned For
Owner Type
Purchase Details
Closed on
Aug 29, 2011
Sold by
Stewart Barry D and Stewart Michelle M
Bought by
Stewart Jeffrey E
Current Estimated Value
Home Financials for this Owner
Home Financials are based on the most recent Mortgage that was taken out on this home.
Original Mortgage
$109,000
Outstanding Balance
$75,140
Interest Rate
4.4%
Mortgage Type
Stand Alone Refi Refinance Of Original Loan
Estimated Equity
$324,008
Purchase Details
Closed on
Dec 20, 2004
Sold by
Myers Marjorie C
Bought by
Stewart Barry D and Stewart Michelle M
Home Financials for this Owner
Home Financials are based on the most recent Mortgage that was taken out on this home.
Original Mortgage
$181,925
Interest Rate
5.71%
Mortgage Type
Purchase Money Mortgage
Purchase Details
Closed on
Nov 16, 2001
Sold by
Marjorie Myers I
Bought by
Myers Marjorie C 2001 Trust
Purchase Details
Closed on
Mar 24, 1997
Sold by
Cleland Robert
Bought by
Scotti Tara D
Create a Home Valuation Report for This Property
The Home Valuation Report is an in-depth analysis detailing your home's value as well as a comparison with similar homes in the area
Home Values in the Area
Average Home Value in this Area
Purchase History
| Date | Buyer | Sale Price | Title Company |
|---|---|---|---|
| Stewart Jeffrey E | $159,000 | Attorney | |
| Stewart Barry D | $191,500 | Watson Title Services Inc | |
| Myers Marjorie C 2001 Trust | -- | -- | |
| Scotti Tara D | $9,000 | -- |
Source: Public Records
Mortgage History
| Date | Status | Borrower | Loan Amount |
|---|---|---|---|
| Open | Stewart Jeffrey E | $109,000 | |
| Previous Owner | Stewart Barry D | $181,925 |
Source: Public Records
Tax History Compared to Growth
Tax History
| Year | Tax Paid | Tax Assessment Tax Assessment Total Assessment is a certain percentage of the fair market value that is determined by local assessors to be the total taxable value of land and additions on the property. | Land | Improvement |
|---|---|---|---|---|
| 2025 | $2,597 | $185,432 | -- | -- |
| 2024 | $2,417 | $185,432 | -- | -- |
| 2023 | $2,417 | $174,957 | $0 | $0 |
| 2022 | $2,310 | $169,861 | $0 | $0 |
| 2021 | $2,265 | $164,914 | $0 | $0 |
| 2020 | $2,149 | $162,637 | $0 | $0 |
| 2019 | $2,200 | $158,980 | $0 | $0 |
| 2018 | $2,179 | $156,016 | $0 | $0 |
| 2017 | $2,134 | $188,962 | $45,000 | $143,962 |
| 2016 | $2,107 | $167,265 | $40,000 | $127,265 |
| 2015 | $2,141 | $169,920 | $40,000 | $129,920 |
| 2014 | $2,187 | $156,248 | $45,000 | $111,248 |
Source: Public Records
Map
Nearby Homes
- 356 Haverlake Cir
- 368 Haverlake Cir
- 2630 Brecca Ct
- 416 Haverlake Cir
- 2701 Canterclub Trail
- 270 Queensberry Ct
- 208 Frinton Cove
- 290 Queensberry Ct
- 240 N Line Dr
- 2528 Canterclub Trail
- 2714 Balkan St
- 267 New Waterford Place
- 217 Lochberry Place
- 215 Canterclub Trail
- 2725 Nova Dr
- 2713 Candlewood Ct
- 2434 Walnut Heights Rd
- 2719 Candlewood Ct
- 2343 Walnut Heights Rd
- 538 Majestic Oak Dr
- 348 Haverlake Cir
- 340 Haverlake Cir
- 352 Haverlake Cir
- 336 Haverlake Cir
- 481 Wekiva Cove Rd
- 485 Wekiva Cove Rd
- 2739 Wekiva Meadows Ct
- 228 Milford Haven Cove
- 347 Haverlake Cir
- 224 Milford Haven Cove
- 489 Wekiva Cove Rd
- 332 Haverlake Cir
- 351 Haverlake Cir
- 331 Haverlake Cir
- 2733 Wekiva Meadows Ct
- 220 Milford Haven Cove
- 493 Wekiva Cove Rd
- 360 Haverlake Cir
- 355 Haverlake Cir
- 328 Haverlake Cir