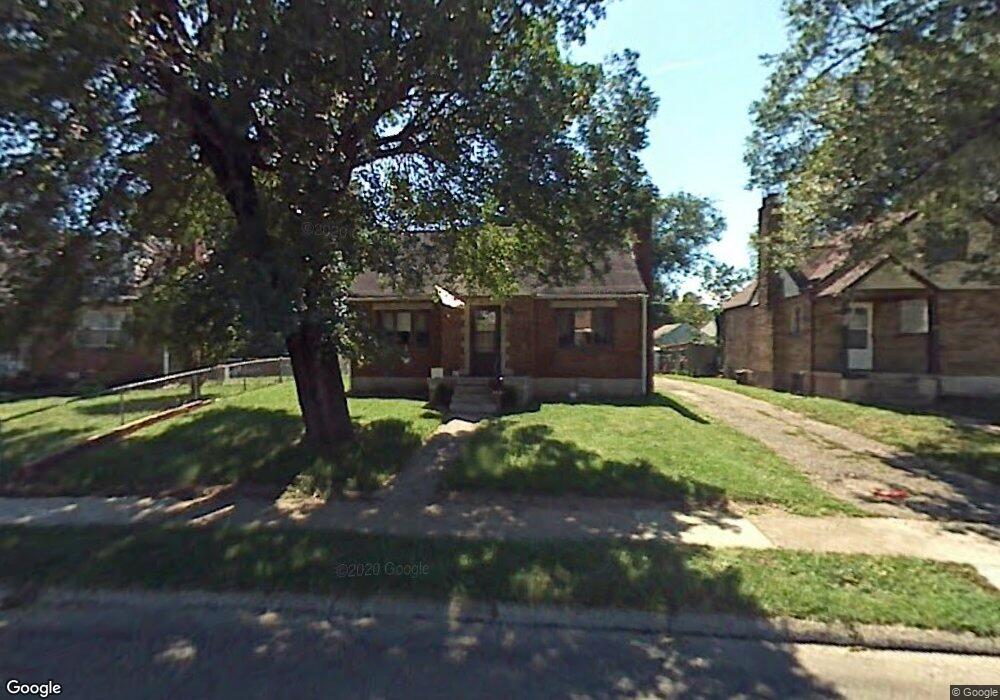
344 Holmes Dr Fairborn, OH 45324
Estimated Value: $113,000 - $159,605
4
Beds
1
Bath
1,107
Sq Ft
$122/Sq Ft
Est. Value
About This Home
This home is located at 344 Holmes Dr, Fairborn, OH 45324 and is currently estimated at $135,151, approximately $122 per square foot. 344 Holmes Dr is a home located in Greene County with nearby schools including Fairborn Primary School, Fairborn Intermediate School, and Fairborn Middle School.
Ownership History
Date
Name
Owned For
Owner Type
Purchase Details
Closed on
Dec 31, 2020
Sold by
Vb One Llc
Bought by
Vb Two Llc
Current Estimated Value
Purchase Details
Closed on
Aug 6, 2020
Sold by
Beam Judy
Bought by
Vb One Llc
Purchase Details
Closed on
Oct 21, 2013
Sold by
Secretary Of Hud
Bought by
Beam Judy
Purchase Details
Closed on
Jan 9, 2013
Sold by
Jpmorgan Chase Bank Na
Bought by
Secretary Of Hud
Purchase Details
Closed on
Nov 27, 2012
Sold by
Gibson Levi Z
Bought by
Jpmorgan Chase Bank Na
Purchase Details
Closed on
Nov 30, 2005
Sold by
Harris Patrice S and Harris Patrick
Bought by
Gibson Levi Z and Gibson Cassie N
Home Financials for this Owner
Home Financials are based on the most recent Mortgage that was taken out on this home.
Original Mortgage
$86,049
Interest Rate
6.2%
Mortgage Type
FHA
Create a Home Valuation Report for This Property
The Home Valuation Report is an in-depth analysis detailing your home's value as well as a comparison with similar homes in the area
Home Values in the Area
Average Home Value in this Area
Purchase History
| Date | Buyer | Sale Price | Title Company |
|---|---|---|---|
| Vb Two Llc | $159,600 | None Available | |
| Vb One Llc | $70,000 | None Available | |
| Beam Judy | -- | None Available | |
| Secretary Of Hud | -- | None Available | |
| Jpmorgan Chase Bank Na | $60,000 | None Available | |
| Gibson Levi Z | $87,400 | -- |
Source: Public Records
Mortgage History
| Date | Status | Borrower | Loan Amount |
|---|---|---|---|
| Previous Owner | Gibson Levi Z | $86,049 |
Source: Public Records
Tax History Compared to Growth
Tax History
| Year | Tax Paid | Tax Assessment Tax Assessment Total Assessment is a certain percentage of the fair market value that is determined by local assessors to be the total taxable value of land and additions on the property. | Land | Improvement |
|---|---|---|---|---|
| 2024 | $1,786 | $37,290 | $7,810 | $29,480 |
| 2023 | $1,786 | $37,290 | $7,810 | $29,480 |
| 2022 | $2,554 | $27,410 | $4,600 | $22,810 |
| 2021 | $1,828 | $27,410 | $4,600 | $22,810 |
| 2020 | $1,590 | $27,410 | $4,600 | $22,810 |
| 2019 | $1,196 | $20,630 | $4,940 | $15,690 |
| 2018 | $1,208 | $20,630 | $4,940 | $15,690 |
| 2017 | $1,269 | $20,630 | $4,940 | $15,690 |
| 2016 | $1,270 | $21,670 | $4,940 | $16,730 |
| 2015 | $1,211 | $21,670 | $4,940 | $16,730 |
| 2014 | $1,171 | $21,670 | $4,940 | $16,730 |
Source: Public Records
Map
Nearby Homes
- 349 E Xenia Dr
- 000 Morris Dr
- 320 E Xenia Dr
- 112 E Xenia Dr
- 139 Hower Ln
- 303 E Whittier Ave
- 524 Grant St
- 66 S Central Ave
- 530 Wayne Dr
- 47 N Wright Ave
- 711 N Central Ave
- 59 S Wright Ave Unit 63
- 519 Lewis Dr
- 608 S Maple Ave
- 226-230 N Broad St
- 525 Ohio St
- 5 Marchmont Dr
- 849 S Maple Ave
- 852 Princeton Ave
- 849 Princeton Ave