Estimated Value: $479,000 - $494,000
2
Beds
1
Bath
1,753
Sq Ft
$277/Sq Ft
Est. Value
About This Home
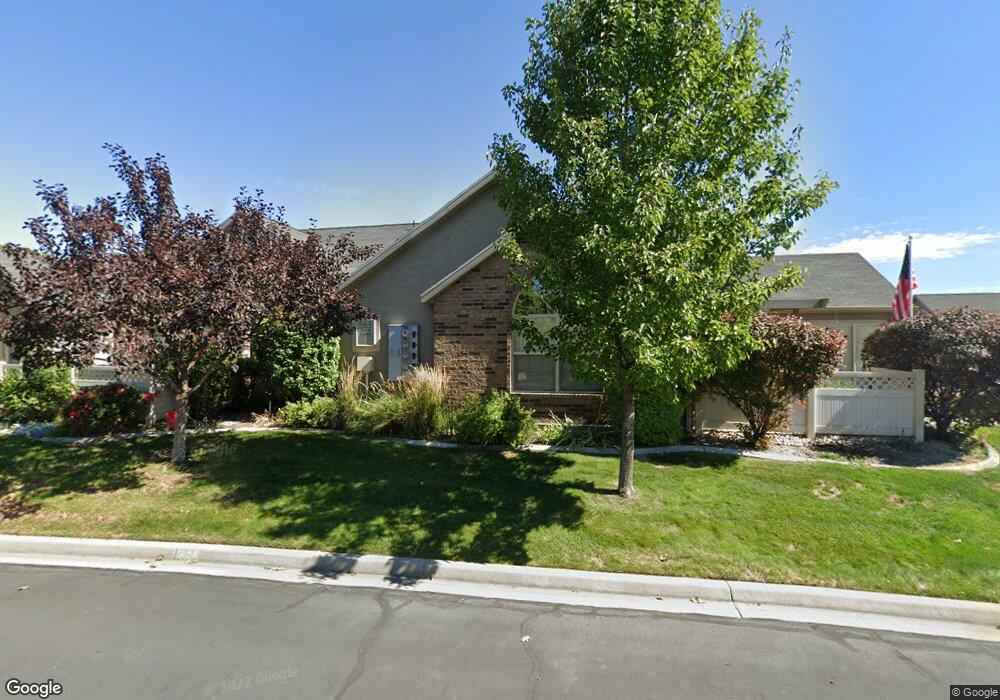
This home is located at 344 N 1100 E Unit 2, Lehi, UT 84043 and is currently estimated at $486,333, approximately $277 per square foot. 344 N 1100 E Unit 2 is a home located in Utah County with nearby schools including Sego Lily Elementary School, Lehi Junior High School, and Skyridge High School.
Ownership History
Date
Name
Owned For
Owner Type
Purchase Details
Closed on
May 11, 2015
Sold by
Yorgason Brenton and Yorgason Margaret
Bought by
Yorgason Brenton G and Yorgason Margaret Yates
Current Estimated Value
Purchase Details
Closed on
Sep 24, 2010
Sold by
Williams Lori and Hertel Jonathan
Bought by
Yorgason Brenton and Yorgason Margaret
Home Financials for this Owner
Home Financials are based on the most recent Mortgage that was taken out on this home.
Original Mortgage
$172,000
Outstanding Balance
$112,825
Interest Rate
4.31%
Mortgage Type
New Conventional
Estimated Equity
$373,508
Purchase Details
Closed on
Feb 20, 2008
Sold by
Schimming Robert W and Schimming Shirliann
Bought by
Schimming Robert W and Schimming Shirliann M
Purchase Details
Closed on
Jan 23, 2006
Sold by
Leisure Villas Inc
Bought by
Schimming Robert W and Schimming Shirliann
Create a Home Valuation Report for This Property
The Home Valuation Report is an in-depth analysis detailing your home's value as well as a comparison with similar homes in the area
Home Values in the Area
Average Home Value in this Area
Purchase History
| Date | Buyer | Sale Price | Title Company |
|---|---|---|---|
| Yorgason Brenton G | -- | None Available | |
| Yorgason Brenton | -- | Surety Title | |
| Schimming Robert W | -- | None Available | |
| Schimming Robert W | -- | Merrill Title Company |
Source: Public Records
Mortgage History
| Date | Status | Borrower | Loan Amount |
|---|---|---|---|
| Open | Yorgason Brenton | $172,000 |
Source: Public Records
Tax History Compared to Growth
Tax History
| Year | Tax Paid | Tax Assessment Tax Assessment Total Assessment is a certain percentage of the fair market value that is determined by local assessors to be the total taxable value of land and additions on the property. | Land | Improvement |
|---|---|---|---|---|
| 2025 | $2,074 | $247,335 | $66,100 | $383,600 |
| 2024 | $1,880 | $242,770 | $0 | $0 |
| 2023 | $1,924 | $238,865 | $0 | $0 |
| 2022 | $1,924 | $237,050 | $0 | $0 |
| 2021 | $1,740 | $324,100 | $48,600 | $275,500 |
| 2020 | $1,458 | $316,100 | $47,400 | $268,700 |
| 2019 | $1,458 | $279,100 | $41,900 | $237,200 |
| 2018 | $1,366 | $247,100 | $37,100 | $210,000 |
| 2017 | $1,413 | $135,905 | $0 | $0 |
| 2016 | $0 | $129,525 | $0 | $0 |
| 2015 | -- | $129,525 | $0 | $0 |
| 2014 | $1,332 | $112,200 | $0 | $0 |
Source: Public Records
Map
Nearby Homes
- 1036 E 310 N Unit K1
- 458 N 1100 E Unit 3
- 328 N 1270 E
- 418 N 1322 E
- 595 N 1200 E
- 735 N 1000 E
- 807 N Somerset Alley
- 1175 E 900 N
- 901 N Lakota Rd
- 428 E 500 N
- 893 N 1580 E
- 822 N 860 W Unit 317
- 705 N 400 E
- 822 W 800 St N Unit LOT319
- 962 N 780 St W Unit 508
- 974 N 780 St W Unit 509
- 916 N 780 St W Unit 501
- 3935 W 1000 N Unit 438
- 3983 W 1000 N Unit 442
- 4007 W 1000 N
- 344 N 1100 E Unit G1
- 344 N 1100 E Unit G3
- 344 N 1100 E Unit G4
- 344 N 1100 E
- 344 N 1100 E Unit 1
- 344 N 1100 E Unit 3
- 314 N 1100 E
- 314 N 1100 E Unit H3
- 314 N 1100 E Unit 3
- 336 N 1030 E Unit T-3
- 336 N 1030 E Unit T1
- 336 N 1030 E Unit 2
- 336 N 1030 E Unit T4
- 374 N 1100 E Unit F1
- 374 N 1100 E Unit F2
- 374 N 1100 E Unit F4
- 374 N 1100 E Unit 21
- 366 N 1030 East S Bldg Unit S-2
- 1066 E 310 N Unit J4
- 1066 E 310 N Unit J1