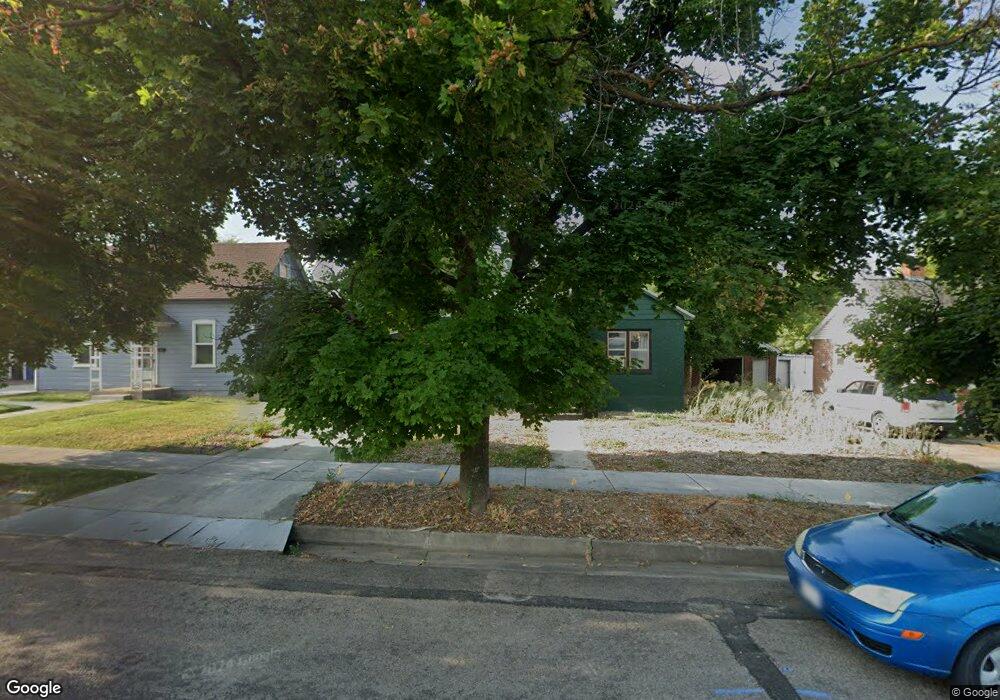
344 W 500 N Logan, UT 84321
Ellis NeighborhoodEstimated Value: $361,000 - $386,000
4
Beds
3
Baths
1,807
Sq Ft
$207/Sq Ft
Est. Value
About This Home
This home is located at 344 W 500 N, Logan, UT 84321 and is currently estimated at $374,337, approximately $207 per square foot. 344 W 500 N is a home located in Cache County with nearby schools including Ellis School, Mount Logan Middle School, and Logan High School.
Ownership History
Date
Name
Owned For
Owner Type
Purchase Details
Closed on
Nov 26, 2024
Sold by
Griffiths Todd and Griffiths Marisa
Bought by
Denison Christopher and Machuca Yiddiani
Current Estimated Value
Home Financials for this Owner
Home Financials are based on the most recent Mortgage that was taken out on this home.
Original Mortgage
$358,900
Outstanding Balance
$355,191
Interest Rate
6.44%
Mortgage Type
New Conventional
Estimated Equity
$19,146
Purchase Details
Closed on
Aug 9, 2021
Sold by
Griffiths Todd
Bought by
Griffiths Todd and Griffiths Marisa
Home Financials for this Owner
Home Financials are based on the most recent Mortgage that was taken out on this home.
Original Mortgage
$237,077
Interest Rate
2.9%
Mortgage Type
New Conventional
Purchase Details
Closed on
Aug 3, 2021
Sold by
Jones David E
Bought by
Griffiths Todd and Griffiths Marisa
Home Financials for this Owner
Home Financials are based on the most recent Mortgage that was taken out on this home.
Original Mortgage
$237,077
Interest Rate
2.9%
Mortgage Type
New Conventional
Purchase Details
Closed on
Jul 29, 2019
Sold by
Egnew Koyle Weston and Egnew Elizabeth Ashley
Bought by
Griffiths Todd and Jones David E
Home Financials for this Owner
Home Financials are based on the most recent Mortgage that was taken out on this home.
Original Mortgage
$208,160
Interest Rate
3.87%
Mortgage Type
FHA
Purchase Details
Closed on
Jul 27, 2009
Sold by
Federal National Mortgage Association
Bought by
Egnew Kyle Weston and Egnew Elizabeth Ashley
Home Financials for this Owner
Home Financials are based on the most recent Mortgage that was taken out on this home.
Original Mortgage
$106,328
Interest Rate
5.59%
Mortgage Type
FHA
Purchase Details
Closed on
May 26, 2009
Sold by
Financial Freedom Sfc
Bought by
Federal National Mortgage Association
Purchase Details
Closed on
Jan 20, 2009
Sold by
Loveday Annabelle and Aim Mortgage Inc
Bought by
Financial Freedom Sfc
Create a Home Valuation Report for This Property
The Home Valuation Report is an in-depth analysis detailing your home's value as well as a comparison with similar homes in the area
Home Values in the Area
Average Home Value in this Area
Purchase History
| Date | Buyer | Sale Price | Title Company |
|---|---|---|---|
| Denison Christopher | -- | Cache Title | |
| Griffiths Todd | -- | Advanced Title | |
| Griffiths Todd | -- | Advanced Title | |
| Griffiths Todd | -- | Advanced Title | |
| Griffiths Todd | -- | Cache Title Logan | |
| Egnew Kyle Weston | $110,000 | Us Title-Tp | |
| Federal National Mortgage Association | -- | Backman Title Services | |
| Financial Freedom Sfc | $93,764 | Backman Title Services |
Source: Public Records
Mortgage History
| Date | Status | Borrower | Loan Amount |
|---|---|---|---|
| Open | Denison Christopher | $358,900 | |
| Previous Owner | Griffiths Todd | $237,077 | |
| Previous Owner | Griffiths Todd | $208,160 | |
| Previous Owner | Egnew Kyle Weston | $106,328 |
Source: Public Records
Tax History
| Year | Tax Paid | Tax Assessment Tax Assessment Total Assessment is a certain percentage of the fair market value that is determined by local assessors to be the total taxable value of land and additions on the property. | Land | Improvement |
|---|---|---|---|---|
| 2025 | $1,566 | $202,590 | $0 | $0 |
| 2024 | $129 | $161,205 | $0 | $0 |
| 2023 | $246 | $293,290 | $0 | $0 |
| 2022 | $2,981 | $332,370 | $0 | $0 |
| 2021 | $2,408 | $228,140 | $41,200 | $186,940 |
| 2020 | $1,193 | $185,000 | $41,200 | $143,800 |
| 2019 | $1,247 | $185,000 | $41,200 | $143,800 |
| 2018 | $1,131 | $153,200 | $41,200 | $112,000 |
| 2017 | $1,085 | $77,660 | $0 | $0 |
| 2016 | $1,125 | $73,810 | $0 | $0 |
| 2015 | $1,070 | $73,810 | $0 | $0 |
| 2014 | $951 | $72,600 | $0 | $0 |
| 2013 | -- | $71,215 | $0 | $0 |
Source: Public Records
Map
Nearby Homes
Your Personal Tour Guide
Ask me questions while you tour the home.