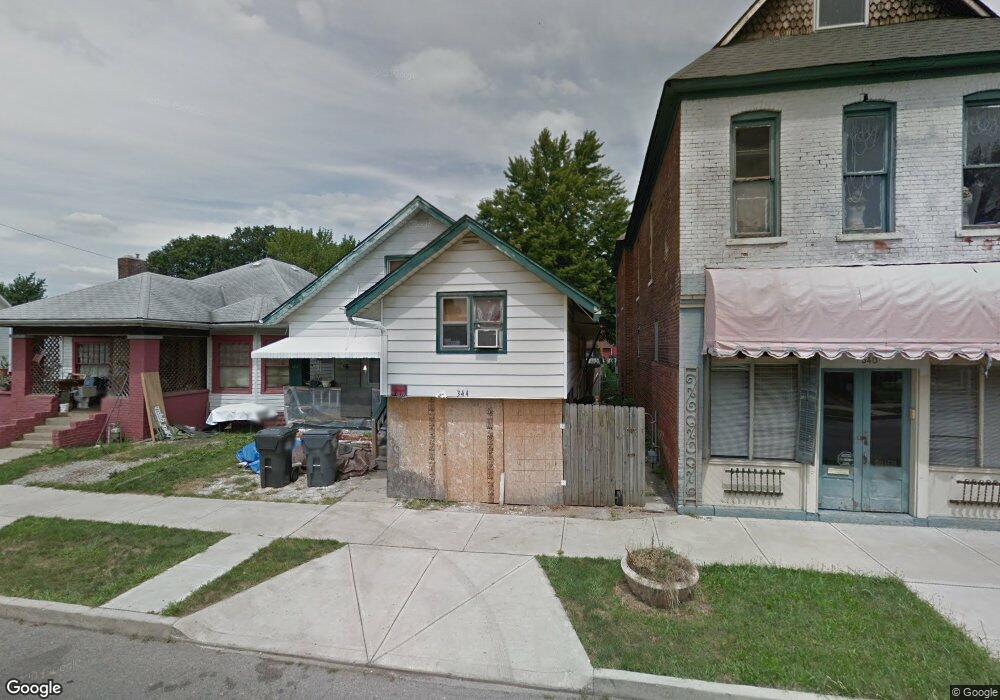
344 W 5th St Anderson, IN 46016
Estimated Value: $108,000 - $147,000
4
Beds
2
Baths
2,482
Sq Ft
$53/Sq Ft
Est. Value
About This Home
This home is located at 344 W 5th St, Anderson, IN 46016 and is currently estimated at $131,243, approximately $52 per square foot. 344 W 5th St is a home located in Madison County with nearby schools including Eastside Elementary School, Highland Middle School, and Anderson High School.
Ownership History
Date
Name
Owned For
Owner Type
Purchase Details
Closed on
May 8, 2024
Sold by
Syracuse Investment Group Llc
Bought by
Holloway Gwynne K and Holloway Ryan C
Current Estimated Value
Home Financials for this Owner
Home Financials are based on the most recent Mortgage that was taken out on this home.
Original Mortgage
$101,250
Outstanding Balance
$99,806
Interest Rate
6.79%
Mortgage Type
New Conventional
Estimated Equity
$31,437
Purchase Details
Closed on
Oct 23, 2023
Sold by
Altamar Enterprise Llc
Bought by
Syracuse Investment Group Llc
Purchase Details
Closed on
Nov 9, 2022
Sold by
Picket Fence Property Company
Bought by
Altamar Enterprises Llc
Purchase Details
Closed on
Aug 23, 2021
Sold by
Mckibben Chad A
Bought by
Picket Fence Property Co
Purchase Details
Closed on
Feb 17, 2006
Sold by
Price Chris L and Wardwell John
Bought by
Deutsche Bank Trust Co
Create a Home Valuation Report for This Property
The Home Valuation Report is an in-depth analysis detailing your home's value as well as a comparison with similar homes in the area
Home Values in the Area
Average Home Value in this Area
Purchase History
| Date | Buyer | Sale Price | Title Company |
|---|---|---|---|
| Holloway Gwynne K | -- | Eagle Land Title | |
| Syracuse Investment Group Llc | $82,640 | None Listed On Document | |
| Altamar Enterprises Llc | -- | -- | |
| Picket Fence Property Co | $13,000 | None Available | |
| Deutsche Bank Trust Co | $54,252 | -- |
Source: Public Records
Mortgage History
| Date | Status | Borrower | Loan Amount |
|---|---|---|---|
| Open | Holloway Gwynne K | $101,250 |
Source: Public Records
Tax History Compared to Growth
Tax History
| Year | Tax Paid | Tax Assessment Tax Assessment Total Assessment is a certain percentage of the fair market value that is determined by local assessors to be the total taxable value of land and additions on the property. | Land | Improvement |
|---|---|---|---|---|
| 2024 | $980 | $44,100 | $4,700 | $39,400 |
| 2023 | $436 | $19,500 | $4,500 | $15,000 |
| 2022 | $427 | $19,100 | $4,200 | $14,900 |
| 2021 | $497 | $22,000 | $4,200 | $17,800 |
| 2020 | $476 | $21,000 | $4,000 | $17,000 |
| 2019 | $466 | $20,500 | $4,000 | $16,500 |
| 2018 | $443 | $19,100 | $4,000 | $15,100 |
| 2017 | $380 | $18,900 | $4,000 | $14,900 |
| 2016 | $380 | $18,900 | $4,000 | $14,900 |
| 2014 | $672 | $33,500 | $4,100 | $29,400 |
| 2013 | $672 | $33,500 | $4,100 | $29,400 |
Source: Public Records
Map
Nearby Homes