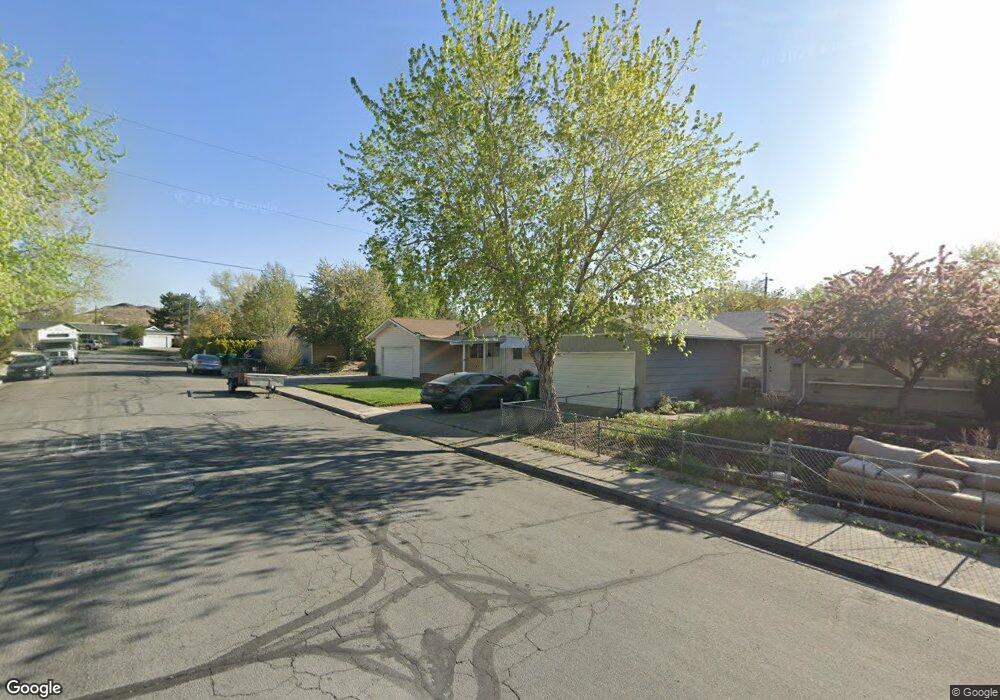
3440 Nowlin Ln Sparks, NV 89431
McCarran Boulevard-Probasco NeighborhoodEstimated Value: $372,000 - $404,000
3
Beds
2
Baths
988
Sq Ft
$388/Sq Ft
Est. Value
About This Home
This home is located at 3440 Nowlin Ln, Sparks, NV 89431 and is currently estimated at $383,821, approximately $388 per square foot. 3440 Nowlin Ln is a home located in Washoe County with nearby schools including Lena Juniper Elementary School, Lou Mendive Middle School, and Edward C Reed High School.
Ownership History
Date
Name
Owned For
Owner Type
Purchase Details
Closed on
Apr 6, 2022
Sold by
D & J Trust
Bought by
Nowlin Llc
Current Estimated Value
Purchase Details
Closed on
Mar 7, 2022
Sold by
Otto Donald L and Otto Judith A
Bought by
D & J Trust
Purchase Details
Closed on
Jan 11, 1996
Sold by
Pergrossi Rachel Nell
Bought by
Otto Donald L and Otto Judith A
Home Financials for this Owner
Home Financials are based on the most recent Mortgage that was taken out on this home.
Original Mortgage
$72,800
Interest Rate
7.38%
Purchase Details
Closed on
May 16, 1995
Sold by
Pergrossi Evan D
Bought by
Pergrossi Evan D and Pergrossi Rachel Nell
Create a Home Valuation Report for This Property
The Home Valuation Report is an in-depth analysis detailing your home's value as well as a comparison with similar homes in the area
Home Values in the Area
Average Home Value in this Area
Purchase History
| Date | Buyer | Sale Price | Title Company |
|---|---|---|---|
| Nowlin Llc | -- | Law Office Of Judith A Otto Lt | |
| D & J Trust | -- | Law Office Of Judith A Otto Lt | |
| Otto Donald L | $104,000 | First Centennial Title Co | |
| Pergrossi Evan D | -- | -- |
Source: Public Records
Mortgage History
| Date | Status | Borrower | Loan Amount |
|---|---|---|---|
| Previous Owner | Otto Donald L | $72,800 |
Source: Public Records
Tax History
| Year | Tax Paid | Tax Assessment Tax Assessment Total Assessment is a certain percentage of the fair market value that is determined by local assessors to be the total taxable value of land and additions on the property. | Land | Improvement |
|---|---|---|---|---|
| 2026 | $1,102 | $53,070 | $36,540 | $16,530 |
| 2024 | $1,021 | $50,939 | $34,755 | $16,184 |
| 2023 | $947 | $49,897 | $34,930 | $14,967 |
| 2022 | $878 | $40,644 | $28,455 | $12,189 |
| 2021 | $814 | $31,507 | $19,635 | $11,872 |
| 2020 | $763 | $29,503 | $17,850 | $11,653 |
| 2019 | $728 | $29,796 | $18,725 | $11,071 |
| 2018 | $696 | $24,164 | $13,545 | $10,619 |
| 2017 | $669 | $22,512 | $12,075 | $10,437 |
| 2016 | $651 | $21,950 | $11,550 | $10,400 |
| 2015 | $329 | $19,765 | $9,415 | $10,350 |
| 2014 | $630 | $18,381 | $7,980 | $10,401 |
| 2013 | -- | $16,728 | $5,985 | $10,743 |
Source: Public Records
Map
Nearby Homes
- 240 E Gault Way
- 3222 Bunker Hill Ln
- 3104 Sandy St
- 3273 N Truckee Ln
- 491 E Emerson Way
- 3122 Shari Way
- 2557 Janelle Dr
- 3214 Valley Forge Way
- 2520 Nelson Way
- 2475 Stine Way
- 5530 High Rock Way
- 3126 N Truckee Ln
- 867 Spanish Springs Rd
- 28 Arndell Way
- 705 York Way
- 930 Spanish Springs Rd
- 343 Richards Way
- 1940 4th St Unit 20
- 1940 4th St Unit 51
- 1940 4th St Unit 46
- 3430 Nowlin Ln
- 3450 Nowlin Ln
- 3460 Nowlin Ln
- 3420 Nowlin Ln
- 3425 Strasser Dr
- 3445 Strasser Dr
- 3435 Strasser Dr
- 3435 Nowlin Ln
- 3445 Nowlin Ln
- 3415 Strasser Dr
- 3455 Strasser Dr
- 3480 Nowlin Ln
- 3415 Nowlin Ln Unit 4D
- 3455 Nowlin Ln
- 3410 Nowlin Ln
- 3405 Strasser Dr
- 3490 Nowlin Ln
- 3405 Nowlin Ln
- 3465 Nowlin Ln
- 3440 Strasser Dr
Your Personal Tour Guide
Ask me questions while you tour the home.