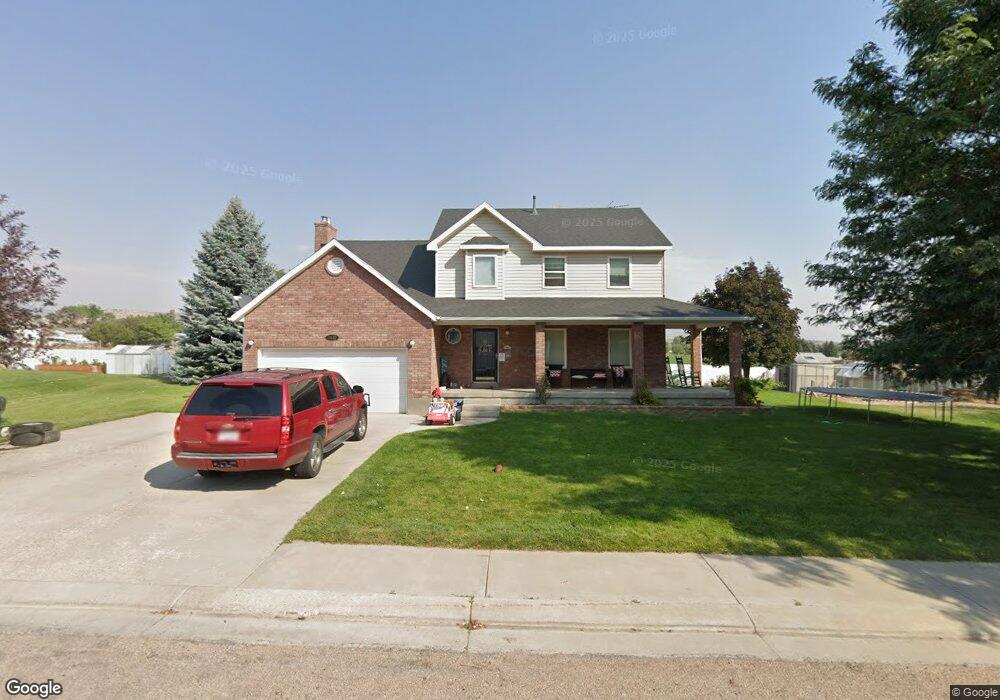
3440 W 1600 N Vernal, UT 84078
Estimated Value: $448,000 - $561,000
5
Beds
4
Baths
3,071
Sq Ft
$162/Sq Ft
Est. Value
About This Home
This home is located at 3440 W 1600 N, Vernal, UT 84078 and is currently estimated at $496,124, approximately $161 per square foot. 3440 W 1600 N is a home located in Uintah County with nearby schools including Maeser School, Uintah Middle School, and Vernal Middle School.
Ownership History
Date
Name
Owned For
Owner Type
Purchase Details
Closed on
Mar 24, 2023
Sold by
Foster Matthew E
Bought by
Foster Matthew E and Foster Morgan E
Current Estimated Value
Home Financials for this Owner
Home Financials are based on the most recent Mortgage that was taken out on this home.
Original Mortgage
$450,120
Outstanding Balance
$429,693
Interest Rate
4%
Mortgage Type
VA
Estimated Equity
$66,431
Purchase Details
Closed on
Dec 3, 2021
Sold by
Blake-Sprouse Thomas and Sprouse Brooke
Bought by
Esrada Davith and Estrada Brandy
Home Financials for this Owner
Home Financials are based on the most recent Mortgage that was taken out on this home.
Original Mortgage
$354,420
Interest Rate
3.11%
Purchase Details
Closed on
Jun 16, 2017
Sold by
Mcclellan Clark A and Mcclellan Robin Murray
Bought by
Sprouse Thomas Blake and Sprouse Brooke
Create a Home Valuation Report for This Property
The Home Valuation Report is an in-depth analysis detailing your home's value as well as a comparison with similar homes in the area
Home Values in the Area
Average Home Value in this Area
Purchase History
| Date | Buyer | Sale Price | Title Company |
|---|---|---|---|
| Foster Matthew E | -- | Sunrise Title | |
| Foster Matthew E | -- | North Star Title | |
| Esrada Davith | -- | None Available | |
| Estrada Davith | -- | None Available | |
| Estrada Davith | -- | New Title Company Name | |
| Sprouse Thomas Blake | -- | Advanced Title |
Source: Public Records
Mortgage History
| Date | Status | Borrower | Loan Amount |
|---|---|---|---|
| Open | Foster Matthew E | $450,120 | |
| Previous Owner | Estrada Davith | $354,420 |
Source: Public Records
Tax History Compared to Growth
Tax History
| Year | Tax Paid | Tax Assessment Tax Assessment Total Assessment is a certain percentage of the fair market value that is determined by local assessors to be the total taxable value of land and additions on the property. | Land | Improvement |
|---|---|---|---|---|
| 2024 | $2,246 | $253,901 | $14,616 | $239,285 |
| 2023 | $2,174 | $208,410 | $14,616 | $193,794 |
| 2022 | $1,726 | $163,910 | $22,000 | $141,910 |
| 2021 | $1,717 | $73,531 | $10,588 | $62,944 |
| 2020 | $1,675 | $133,693 | $19,250 | $114,443 |
| 2019 | $1,696 | $133,693 | $19,250 | $114,443 |
| 2018 | $1,626 | $128,244 | $19,250 | $108,994 |
| 2017 | $18 | $144,115 | $19,250 | $124,865 |
| 2016 | $1,709 | $147,977 | $19,250 | $128,727 |
| 2015 | $1,577 | $147,977 | $19,250 | $128,727 |
| 2014 | $1,554 | $147,977 | $19,250 | $128,727 |
| 2013 | $1,588 | $147,977 | $19,250 | $128,727 |
Source: Public Records
Map
Nearby Homes