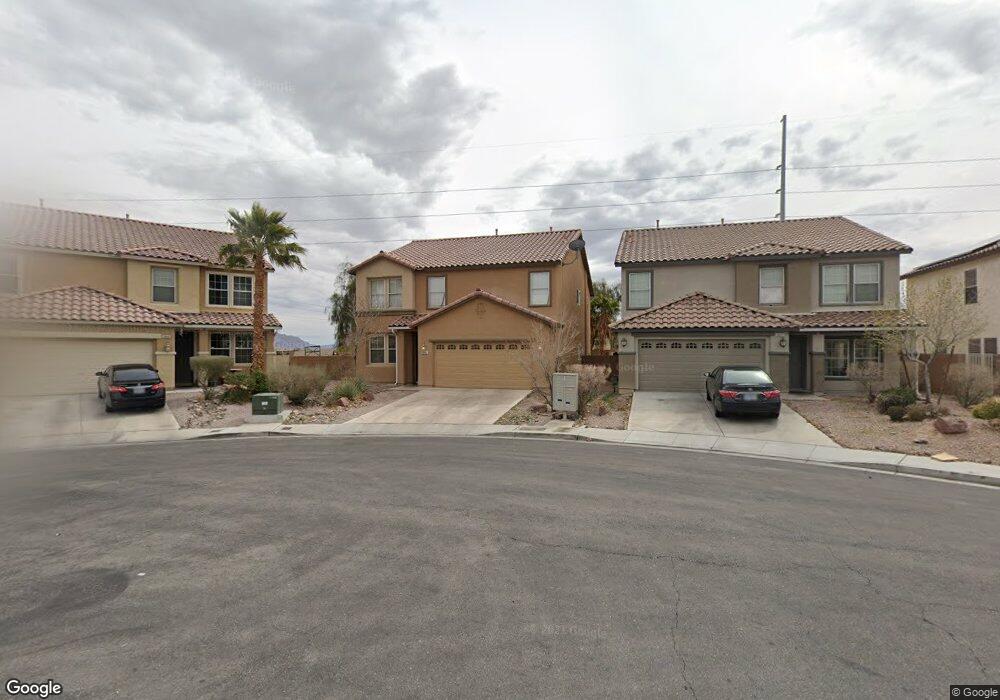
3441 Conterra Park Ave North Las Vegas, NV 89081
Northridge NeighborhoodEstimated Value: $450,000 - $505,000
4
Beds
3
Baths
2,784
Sq Ft
$170/Sq Ft
Est. Value
About This Home
This home is located at 3441 Conterra Park Ave, North Las Vegas, NV 89081 and is currently estimated at $472,284, approximately $169 per square foot. 3441 Conterra Park Ave is a home located in Clark County with nearby schools including John Tartan Elementary School, Carroll M. Johnston STEM Academy of Environmental Studies, and Clifford O. Findlay Middle School.
Ownership History
Date
Name
Owned For
Owner Type
Purchase Details
Closed on
May 12, 2011
Sold by
The Asset Transfer Revocable Trust Agree
Bought by
4 Las Vegas Rental Homes Corp
Current Estimated Value
Purchase Details
Closed on
Mar 1, 2011
Sold by
Asset Transfer Revocable Trust
Bought by
4 Las Vegas Rental Homes Corp
Purchase Details
Closed on
Sep 16, 2010
Sold by
Jpmorgan Chase Bank National Association
Bought by
Erlichman Dov and The Asset Transfer Revocable Trust
Purchase Details
Closed on
Apr 20, 2010
Sold by
Buntic Tomislav
Bought by
Jpmorgan Chase Bank National Association
Purchase Details
Closed on
Aug 8, 2005
Sold by
Buntic Roalija
Bought by
Buntic Tomsaliv
Home Financials for this Owner
Home Financials are based on the most recent Mortgage that was taken out on this home.
Original Mortgage
$269,260
Interest Rate
5.31%
Create a Home Valuation Report for This Property
The Home Valuation Report is an in-depth analysis detailing your home's value as well as a comparison with similar homes in the area
Home Values in the Area
Average Home Value in this Area
Purchase History
| Date | Buyer | Sale Price | Title Company |
|---|---|---|---|
| 4 Las Vegas Rental Homes Corp | -- | None Available | |
| 4 Las Vegas Rental Homes Corp | -- | None Available | |
| Erlichman Dov | $139,000 | Fidelity Rainbow | |
| Jpmorgan Chase Bank National Association | $128,054 | Fidelity National Default S | |
| Buntic Tomsaliv | -- | First Amer Title Co Of Nv | |
| Buntic Tomislav | $336,575 | First Amer Title Co Of Nv |
Source: Public Records
Mortgage History
| Date | Status | Borrower | Loan Amount |
|---|---|---|---|
| Previous Owner | Buntic Tomislav | $269,260 |
Source: Public Records
Tax History Compared to Growth
Tax History
| Year | Tax Paid | Tax Assessment Tax Assessment Total Assessment is a certain percentage of the fair market value that is determined by local assessors to be the total taxable value of land and additions on the property. | Land | Improvement |
|---|---|---|---|---|
| 2025 | $2,416 | $137,533 | $32,900 | $104,633 |
| 2024 | $2,237 | $137,533 | $32,900 | $104,633 |
| 2023 | $2,237 | $131,377 | $32,900 | $98,477 |
| 2022 | $2,172 | $115,427 | $25,550 | $89,877 |
| 2021 | $2,012 | $107,388 | $22,400 | $84,988 |
| 2020 | $1,865 | $105,596 | $21,350 | $84,246 |
| 2019 | $1,748 | $101,843 | $18,900 | $82,943 |
| 2018 | $1,668 | $86,881 | $15,750 | $71,131 |
| 2017 | $2,562 | $76,298 | $14,000 | $62,298 |
| 2016 | $1,580 | $66,415 | $10,150 | $56,265 |
| 2015 | $1,576 | $55,196 | $8,400 | $46,796 |
| 2014 | $1,527 | $44,106 | $5,600 | $38,506 |
Source: Public Records
Map
Nearby Homes
- 3425 Palatine Hills Ave
- 5913 Saratoga Reserve St
- 3405 Brook Song Ave
- 5828 Autumn Damask St
- 3156 Mclennan Ave
- 6040 Eganridge Ct
- 3425 Edinboro Ridge Ave Unit 6
- 6052 Puesta Del Sol St
- 3217 Aspinwall Ct
- 3709 Citrus Heights Ave
- 3712 Rocklin Peak Ave
- 5745 Sagamore Canyon St
- 3720 Gallowtree Ave
- 3712 Garnet Heights Ave
- 3208 Aspinwall Ct
- 3728 Garnet Heights Ave
- 5829 Summit Greens St
- 3736 Rocklin Peak Ave
- 3339 Cromford Dr
- 5805 Hannah Brook St
- 3437 Conterra Park Ave
- 3445 Conterra Park Ave
- 3433 Conterra Park Ave
- 6004 Thornton St
- 3429 Conterra Park Ave
- 6008 Thornton St
- 3436 Conterra Park Ave
- 3425 Conterra Park Ave
- 3432 Conterra Park Ave
- 6012 Thornton St
- 3428 Conterra Park Ave
- 3421 Conterra Park Ave
- 3424 May Time Ave
- 3420 May Time Ave
- 6016 Thornton St
- 3424 Conterra Park Ave
- 3416 May Time Ave
- 3428 May Time Ave
- 3417 Conterra Park Ave
- 3437 Palatine Hills Ave