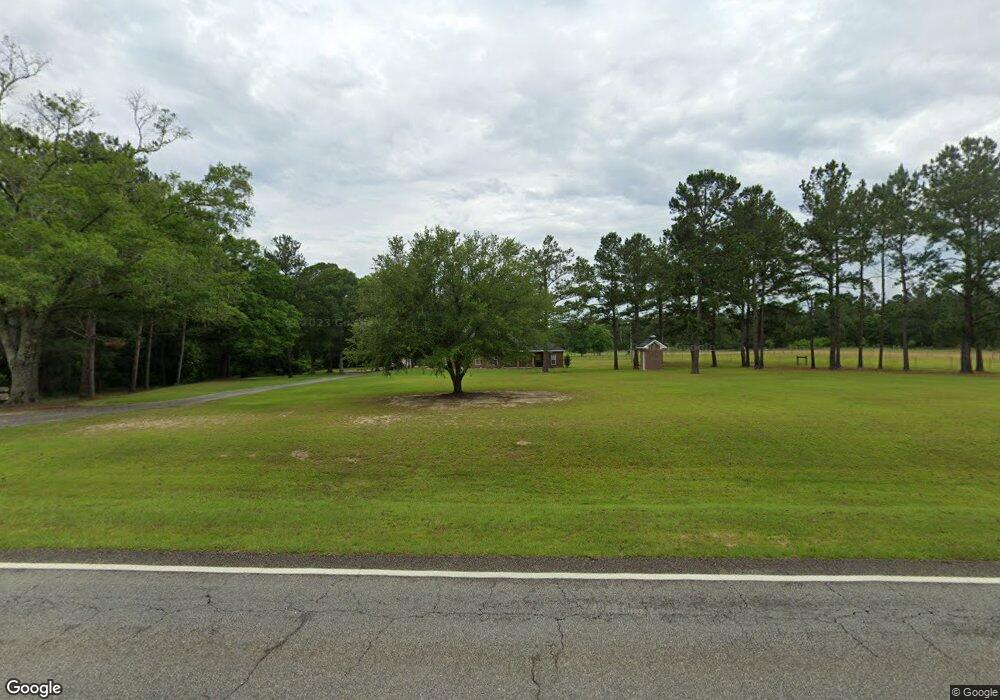
3441 Ga Highway 33 N Sylvester, GA 31791
Estimated Value: $284,000 - $416,000
--
Bed
--
Bath
2,150
Sq Ft
$163/Sq Ft
Est. Value
About This Home
This home is located at 3441 Ga Highway 33 N, Sylvester, GA 31791 and is currently estimated at $351,364, approximately $163 per square foot. 3441 Ga Highway 33 N is a home with nearby schools including Worth County Primary School, Worth County Elementary School, and Worth County Middle School.
Ownership History
Date
Name
Owned For
Owner Type
Purchase Details
Closed on
Aug 20, 2021
Sold by
Lawson Lisa
Bought by
Wilson Justin A and Busbin Lindy J
Current Estimated Value
Home Financials for this Owner
Home Financials are based on the most recent Mortgage that was taken out on this home.
Original Mortgage
$266,750
Outstanding Balance
$241,824
Interest Rate
2.7%
Mortgage Type
New Conventional
Estimated Equity
$109,540
Purchase Details
Closed on
Jul 6, 2007
Sold by
Sec Of Housing & U
Bought by
Lawson Lisa
Home Financials for this Owner
Home Financials are based on the most recent Mortgage that was taken out on this home.
Original Mortgage
$57,500
Interest Rate
6.52%
Mortgage Type
New Conventional
Purchase Details
Closed on
Dec 5, 2006
Sold by
Regions Bank
Bought by
Sec Of Housing & Urban
Create a Home Valuation Report for This Property
The Home Valuation Report is an in-depth analysis detailing your home's value as well as a comparison with similar homes in the area
Home Values in the Area
Average Home Value in this Area
Purchase History
| Date | Buyer | Sale Price | Title Company |
|---|---|---|---|
| Wilson Justin A | $275,000 | -- | |
| Lawson Lisa | $56,987 | -- | |
| Sec Of Housing & Urban | -- | -- | |
| Regions Bank | -- | -- |
Source: Public Records
Mortgage History
| Date | Status | Borrower | Loan Amount |
|---|---|---|---|
| Open | Wilson Justin A | $266,750 | |
| Previous Owner | Lawson Lisa | $57,500 |
Source: Public Records
Tax History Compared to Growth
Tax History
| Year | Tax Paid | Tax Assessment Tax Assessment Total Assessment is a certain percentage of the fair market value that is determined by local assessors to be the total taxable value of land and additions on the property. | Land | Improvement |
|---|---|---|---|---|
| 2024 | $3,270 | $107,200 | $9,600 | $97,600 |
| 2023 | $3,270 | $107,200 | $9,600 | $97,600 |
| 2022 | $3,328 | $107,200 | $9,600 | $97,600 |
| 2021 | $2,060 | $65,600 | $9,600 | $56,000 |
| 2020 | $2,063 | $65,600 | $9,600 | $56,000 |
| 2019 | $1,294 | $38,737 | $10,968 | $27,769 |
| 2018 | $1,110 | $38,737 | $10,968 | $27,769 |
| 2017 | $1,110 | $38,737 | $10,968 | $27,769 |
| 2016 | $1,054 | $38,737 | $10,968 | $27,769 |
| 2015 | $1,056 | $38,737 | $10,968 | $27,769 |
| 2014 | $1,056 | $38,737 | $10,968 | $27,769 |
| 2013 | -- | $38,737 | $10,968 | $27,769 |
| 2012 | -- | $38,737 | $10,968 | $27,769 |
Source: Public Records
Map
Nearby Homes
- 3783 Georgia 33
- 943 Whiddon Rd
- 163 Country Woods Ct
- 0 Blue Springs Rd Unit 138600
- 0 Blue Springs Rd
- 0 Blue Springs Rd Unit 138601
- 185 Hudson Rd
- 115 Northlake Dr
- 109 Huntington Ct
- 6415 Coverdale Hwy
- 112 Creekwood Cir
- 100 Carriage Ln
- 0 Glynn Cook Rd
- 0 N Isabella St Unit 161570
- 3821 Ga Highway 112 W
- 1011 N Washington St
- 1007 N Isabella St
- 0 S 300 Hwy Unit 59620
- 104 Lynn Cir
- 117 Donna Dr
- 3435 Ga Highway 33 N
- 3401 Ga Highway 33 N
- 3441 Ga Hwy 33n
- 3442 Ga Highway 33 N
- 1801 Medders Rd
- 1779 Medders Rd
- 3504 Ga Highway 33 N
- 1754 Medders Rd
- 1746 Medders Rd
- 3530 Ga Highway 33 N
- 1740 Medders Rd
- 1855 Medders Rd
- 3605 Ga Hwy 33n
- 143 Hilltop Rd
- 3552 Ga Highway 33 N
- 1688 Medders Rd
- 3340 Ga Highway 33 N
- 1812 Medders Rd
- 121 Hilltop Rd
- 000 Hilltop Rd