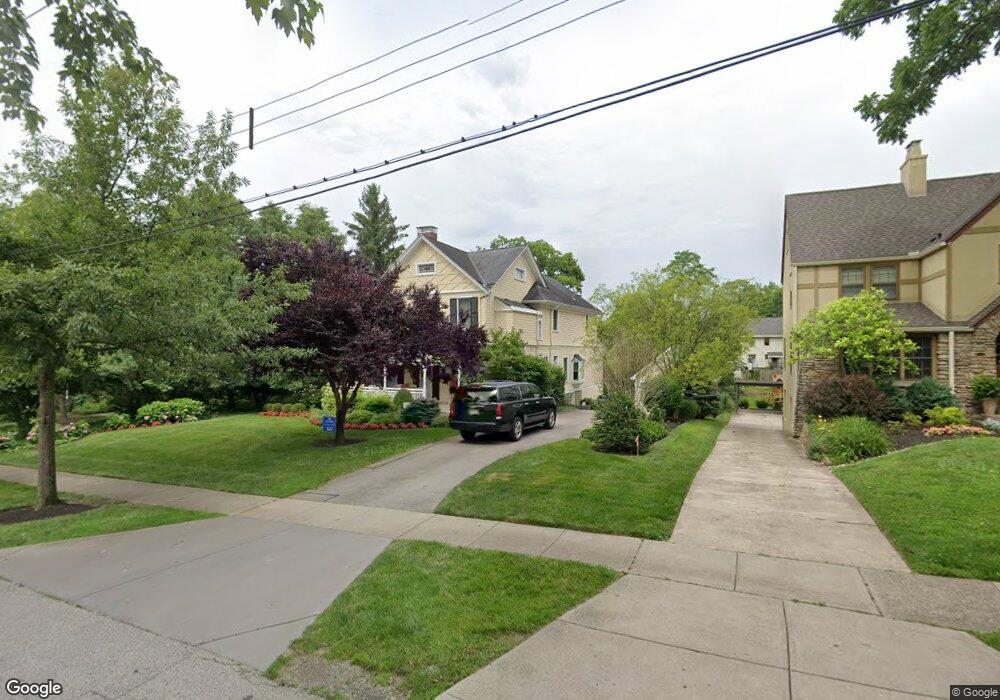
3441 Observatory Place Cincinnati, OH 45208
Hyde Park NeighborhoodEstimated Value: $1,392,000 - $1,553,510
6
Beds
5
Baths
4,159
Sq Ft
$350/Sq Ft
Est. Value
About This Home
This home is located at 3441 Observatory Place, Cincinnati, OH 45208 and is currently estimated at $1,455,837, approximately $350 per square foot. 3441 Observatory Place is a home located in Hamilton County with nearby schools including Kilgour Elementary School, Clark Montessori High School, and Shroder High School.
Ownership History
Date
Name
Owned For
Owner Type
Purchase Details
Closed on
Jul 28, 2016
Sold by
Sumnar Edmund J O and Sumnar Michelle V
Bought by
Sumnar Michelle V
Current Estimated Value
Purchase Details
Closed on
Jun 30, 2011
Sold by
G Miltons Llc
Bought by
3384 Erie Llc
Purchase Details
Closed on
Apr 30, 2004
Sold by
Kennedy J Terry
Bought by
Sumnar Edmund J O and Sumnar Michelle
Home Financials for this Owner
Home Financials are based on the most recent Mortgage that was taken out on this home.
Original Mortgage
$456,000
Interest Rate
4%
Mortgage Type
Unknown
Purchase Details
Closed on
Apr 29, 2004
Sold by
Perez Catherine A
Bought by
Kennedy J Terry
Home Financials for this Owner
Home Financials are based on the most recent Mortgage that was taken out on this home.
Original Mortgage
$456,000
Interest Rate
4%
Mortgage Type
Unknown
Purchase Details
Closed on
Dec 13, 1996
Sold by
Welch Michael B and Welch Shari J
Bought by
Perez Stephen and Richards Catherine A
Create a Home Valuation Report for This Property
The Home Valuation Report is an in-depth analysis detailing your home's value as well as a comparison with similar homes in the area
Home Values in the Area
Average Home Value in this Area
Purchase History
| Date | Buyer | Sale Price | Title Company |
|---|---|---|---|
| Sumnar Michelle V | -- | -- | |
| 3384 Erie Llc | $470,000 | Attorney | |
| Sumnar Edmund J O | -- | -- | |
| Kennedy J Terry | $570,000 | -- | |
| Perez Stephen | $342,000 | Vintage Title Agency Inc |
Source: Public Records
Mortgage History
| Date | Status | Borrower | Loan Amount |
|---|---|---|---|
| Previous Owner | Sumnar Edmund J O | $456,000 | |
| Previous Owner | Kennedy J Terry | $456,000 |
Source: Public Records
Tax History
| Year | Tax Paid | Tax Assessment Tax Assessment Total Assessment is a certain percentage of the fair market value that is determined by local assessors to be the total taxable value of land and additions on the property. | Land | Improvement |
|---|---|---|---|---|
| 2025 | $21,316 | $346,347 | $134,355 | $211,992 |
| 2024 | $20,678 | $346,347 | $134,355 | $211,992 |
| 2023 | $21,138 | $346,347 | $134,355 | $211,992 |
| 2022 | $20,165 | $296,408 | $98,084 | $198,324 |
| 2021 | $19,419 | $296,408 | $98,084 | $198,324 |
| 2020 | $19,983 | $296,408 | $98,084 | $198,324 |
| 2019 | $18,835 | $255,525 | $84,557 | $170,968 |
| 2018 | $18,863 | $255,525 | $84,557 | $170,968 |
| 2017 | $17,925 | $255,525 | $84,557 | $170,968 |
| 2016 | $17,606 | $247,388 | $72,797 | $174,591 |
| 2015 | $15,868 | $247,388 | $72,797 | $174,591 |
| 2014 | $15,981 | $247,388 | $72,797 | $174,591 |
| 2013 | $14,919 | $226,961 | $66,787 | $160,174 |
Source: Public Records
Map
Nearby Homes
- 3525 Herschel View Place
- 1338 Suncrest Dr
- 3443 Ault View Ave
- 1344 Delta Ave
- 3517 Tarpis Ave
- 3613 Herschel Ave
- 1225 Corbett St
- 3649 Herschel Ave
- 3059 Griest Ave
- 3008 Erie Ave
- 3037 Griest Ave
- 3635 Ault Park Ave
- 3057 Portsmouth Ave
- 1231 Grace Ave
- 3109 Linwood Ave
- 4422 Canyon Oak Ct
- 4418 Canyon Oak Ct
- 2947 Iron Oak Ln
- 3414 Oak Ln
- 1346 Herlin Place
- 3445 Observatory Place
- 3435 Observatory Place
- 3451 Observatory Place
- 3440 Wellston Place
- 3280 Observatory Ave
- 3432 Wellston Place
- 3444 Wellston Place
- 3457 Observatory Place
- 3448 Wellston Place
- 3300 Observatory Ave
- 3272 Observatory Ave
- 3459 Observatory Place
- 3268 Observatory Ave
- 3328 Avery Ln
- 3450 Observatory Place
- 3326 Avery Ln
- 3285 Observatory Ave
- 3441 Wellston Place
- 3439 Wellston Place
- 3443 Wellston Place
Your Personal Tour Guide
Ask me questions while you tour the home.