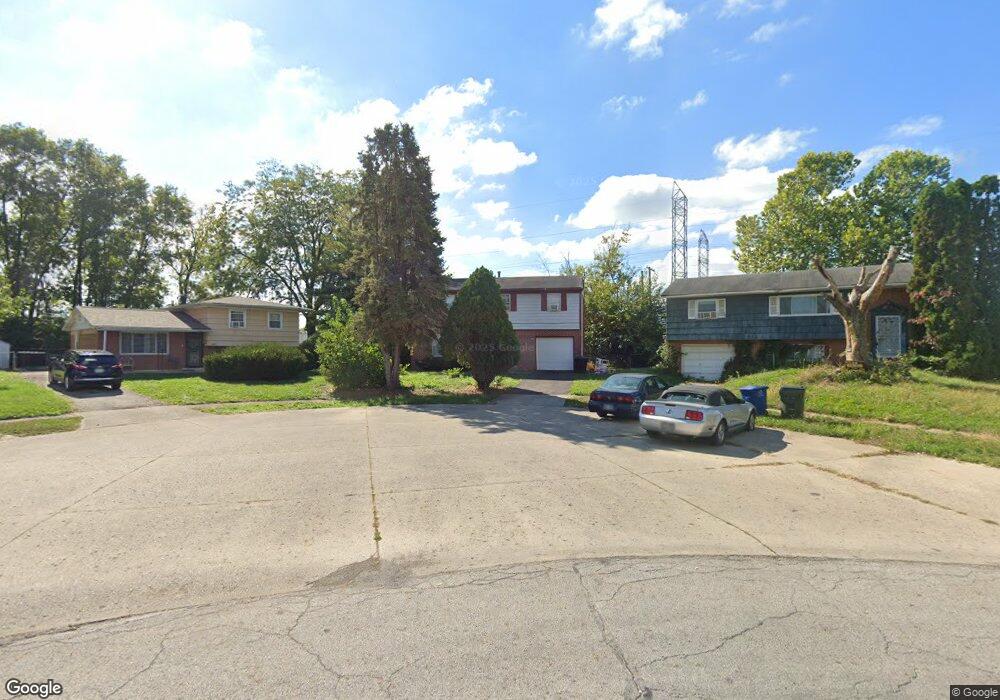
3441 Quaker Rd Columbus, OH 43207
Marion Franklin NeighborhoodEstimated Value: $200,000 - $207,000
4
Beds
2
Baths
1,524
Sq Ft
$134/Sq Ft
Est. Value
About This Home
This home is located at 3441 Quaker Rd, Columbus, OH 43207 and is currently estimated at $203,675, approximately $133 per square foot. 3441 Quaker Rd is a home located in Franklin County with nearby schools including Watkins Elementary School, Buckeye Middle School, and Marion-Franklin High School.
Ownership History
Date
Name
Owned For
Owner Type
Purchase Details
Closed on
Dec 9, 2008
Sold by
Fannie Mae
Bought by
Hopkins William G
Current Estimated Value
Purchase Details
Closed on
Jun 30, 2008
Sold by
Freeman Seku V and Gmac Mortgage Llc
Bought by
Federal National Mortgage Association
Purchase Details
Closed on
Jul 30, 1999
Sold by
Mcmillin Carl L and Mcmillin Bob G
Bought by
Freeman Seku V
Home Financials for this Owner
Home Financials are based on the most recent Mortgage that was taken out on this home.
Original Mortgage
$75,025
Interest Rate
7.77%
Mortgage Type
FHA
Purchase Details
Closed on
Mar 29, 1995
Sold by
Ferguson Lueniga
Bought by
Mcmillin Carl L and Mcmillin Bob G
Home Financials for this Owner
Home Financials are based on the most recent Mortgage that was taken out on this home.
Original Mortgage
$56,748
Interest Rate
8.91%
Mortgage Type
FHA
Create a Home Valuation Report for This Property
The Home Valuation Report is an in-depth analysis detailing your home's value as well as a comparison with similar homes in the area
Home Values in the Area
Average Home Value in this Area
Purchase History
| Date | Buyer | Sale Price | Title Company |
|---|---|---|---|
| Hopkins William G | $30,000 | Title First | |
| Federal National Mortgage Association | $105,995 | Allodial | |
| Freeman Seku V | $75,500 | -- | |
| Mcmillin Carl L | $57,900 | -- |
Source: Public Records
Mortgage History
| Date | Status | Borrower | Loan Amount |
|---|---|---|---|
| Previous Owner | Freeman Seku V | $75,025 | |
| Previous Owner | Mcmillin Carl L | $56,748 |
Source: Public Records
Tax History
| Year | Tax Paid | Tax Assessment Tax Assessment Total Assessment is a certain percentage of the fair market value that is determined by local assessors to be the total taxable value of land and additions on the property. | Land | Improvement |
|---|---|---|---|---|
| 2025 | $2,863 | $45,470 | $13,830 | $31,640 |
| 2024 | $2,863 | $62,480 | $13,830 | $48,650 |
| 2023 | $2,828 | $62,475 | $13,825 | $48,650 |
| 2022 | $1,072 | $20,170 | $10,820 | $9,350 |
| 2021 | $1,074 | $20,170 | $10,820 | $9,350 |
| 2020 | $1,075 | $20,170 | $10,820 | $9,350 |
| 2019 | $1,088 | $17,500 | $9,380 | $8,120 |
| 2018 | $1,020 | $17,500 | $9,380 | $8,120 |
| 2017 | $1,491 | $33,810 | $9,380 | $24,430 |
| 2016 | $880 | $12,950 | $4,410 | $8,540 |
| 2015 | $801 | $12,950 | $4,410 | $8,540 |
| 2014 | $803 | $12,950 | $4,410 | $8,540 |
| 2013 | $396 | $12,950 | $4,410 | $8,540 |
Source: Public Records
Map
Nearby Homes
- 3390 Norwalk Rd
- 3415 Southfield Dr E
- 1433 Venice Dr
- 1514 Orson Dr
- 3551 Groveport Rd
- 1450 Felix Dr
- 3018 Woodway Rd
- 3032 Baker Hill Rd
- 1138 Hilock Rd Unit 35
- 1670 Marshall Ave
- 1124 Rumsey Rd
- 3531 Lockbourne Rd
- 884 Bruckner Rd
- 1249 Evergreen Rd
- 1118 Maplewood Rd
- 1583 Metcalfe Ave
- 3302 Hilock Place
- 3251 Hilock Ct
- 780 Basswood Rd
- 2685 Bulen Ave
Your Personal Tour Guide
Ask me questions while you tour the home.