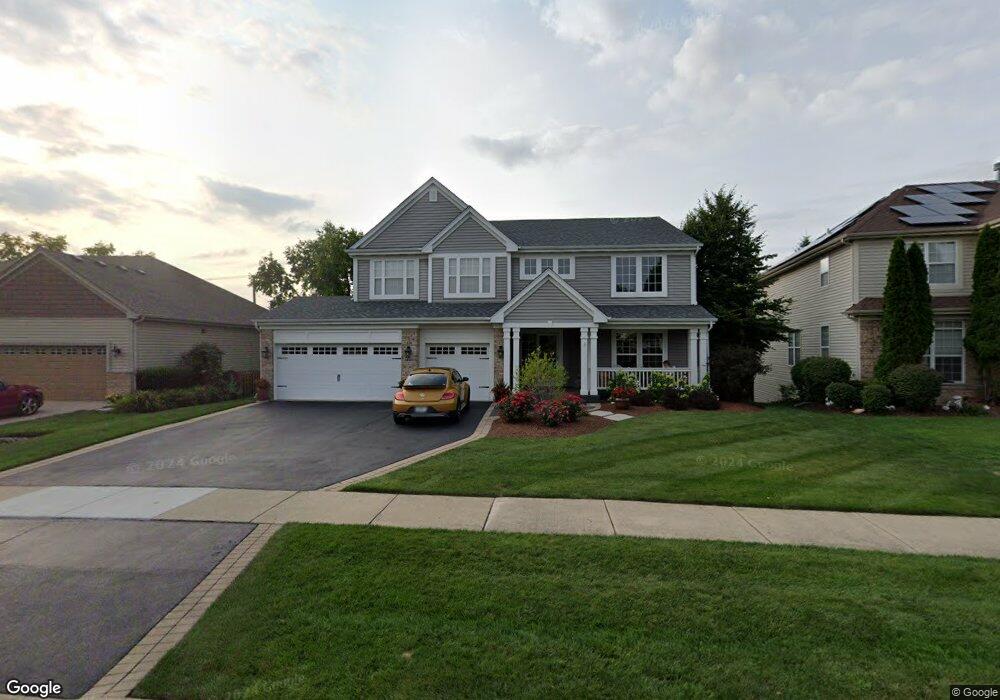
34411 N Bobolink Trail Grayslake, IL 60030
Estimated Value: $522,127 - $562,000
3
Beds
3
Baths
3,147
Sq Ft
$170/Sq Ft
Est. Value
About This Home
This home is located at 34411 N Bobolink Trail, Grayslake, IL 60030 and is currently estimated at $535,782, approximately $170 per square foot. 34411 N Bobolink Trail is a home located in Lake County with nearby schools including Woodland Primary School, Woodland Elementary School, and Woodland Intermediate School.
Ownership History
Date
Name
Owned For
Owner Type
Purchase Details
Closed on
Feb 28, 2014
Sold by
Anderson Noreen M
Bought by
Anderson Noreen M and Anderson Philip T
Current Estimated Value
Home Financials for this Owner
Home Financials are based on the most recent Mortgage that was taken out on this home.
Original Mortgage
$360,000
Outstanding Balance
$271,932
Interest Rate
4.25%
Mortgage Type
VA
Estimated Equity
$263,850
Purchase Details
Closed on
Jan 26, 2004
Sold by
Drh Cambridge Homes Inc
Bought by
Anderson Noreen M
Home Financials for this Owner
Home Financials are based on the most recent Mortgage that was taken out on this home.
Original Mortgage
$399,800
Interest Rate
5.91%
Mortgage Type
Unknown
Create a Home Valuation Report for This Property
The Home Valuation Report is an in-depth analysis detailing your home's value as well as a comparison with similar homes in the area
Home Values in the Area
Average Home Value in this Area
Purchase History
| Date | Buyer | Sale Price | Title Company |
|---|---|---|---|
| Anderson Noreen M | -- | None Available | |
| Anderson Noreen M | $421,000 | First American Title |
Source: Public Records
Mortgage History
| Date | Status | Borrower | Loan Amount |
|---|---|---|---|
| Open | Anderson Noreen M | $360,000 | |
| Closed | Anderson Noreen M | $399,800 |
Source: Public Records
Tax History Compared to Growth
Tax History
| Year | Tax Paid | Tax Assessment Tax Assessment Total Assessment is a certain percentage of the fair market value that is determined by local assessors to be the total taxable value of land and additions on the property. | Land | Improvement |
|---|---|---|---|---|
| 2024 | $11,916 | $149,628 | $18,678 | $130,950 |
| 2023 | -- | $133,523 | $16,668 | $116,855 |
| 2022 | $0 | $129,422 | $16,673 | $112,749 |
| 2021 | $0 | $124,229 | $16,004 | $108,225 |
| 2020 | $0 | $121,176 | $15,611 | $105,565 |
| 2019 | $0 | $117,658 | $15,158 | $102,500 |
| 2018 | $10,456 | $120,630 | $20,679 | $99,951 |
| 2017 | $10,482 | $117,173 | $20,086 | $97,087 |
| 2016 | $10,455 | $111,956 | $19,192 | $92,764 |
| 2015 | $10,684 | $111,186 | $22,754 | $88,432 |
| 2014 | $10,286 | $107,864 | $22,316 | $85,548 |
| 2012 | $9,731 | $108,690 | $22,487 | $86,203 |
Source: Public Records
Map
Nearby Homes
- 18587 W Meander Dr
- 7736 Geneva Dr
- 415 Kingsport Dr
- 528 Cliffwood Ln
- 699 Snow Cap Ct
- 7449 Brentwood Ln
- 34271 N Tangueray Dr
- 34062 N Sulkey Dr
- 34871 N Lake Shore Dr
- 34181 N Old Walnut Cir
- 7493 Bittersweet Dr
- 34115 N Wooded Glen Dr
- 18238 W Gages Lake Rd
- 18564 W Main St
- 303 Mainsail Dr
- 33762 N Oak St
- 18631 W Main St
- 498 Capital Ln
- 33670 N Lake Shore Dr
- 1094 Vista Dr
- 34417 N Bobolink Trail
- 34399 N Bobolink Trail
- 34423 N Bobolink Trail
- 34410 N Bobolink Trail
- 34402 N Bobolink Trail
- 34420 N Bobolink Trail
- 34393 N Bobolink Trail
- 34429 N Bobolink Trail
- 34394 N Bobolink Trail
- 403 Sierra Place
- 409 Sierra Place
- 34428 N Bobolink Trail
- 397 Sierra Place
- 415 Sierra Place
- 34387 N Bobolink Trail
- 421 Sierra Place
- 385 Sierra Place Unit 2
- 34376 N Bobolink Trail
- 34450 N Bobolink Trail