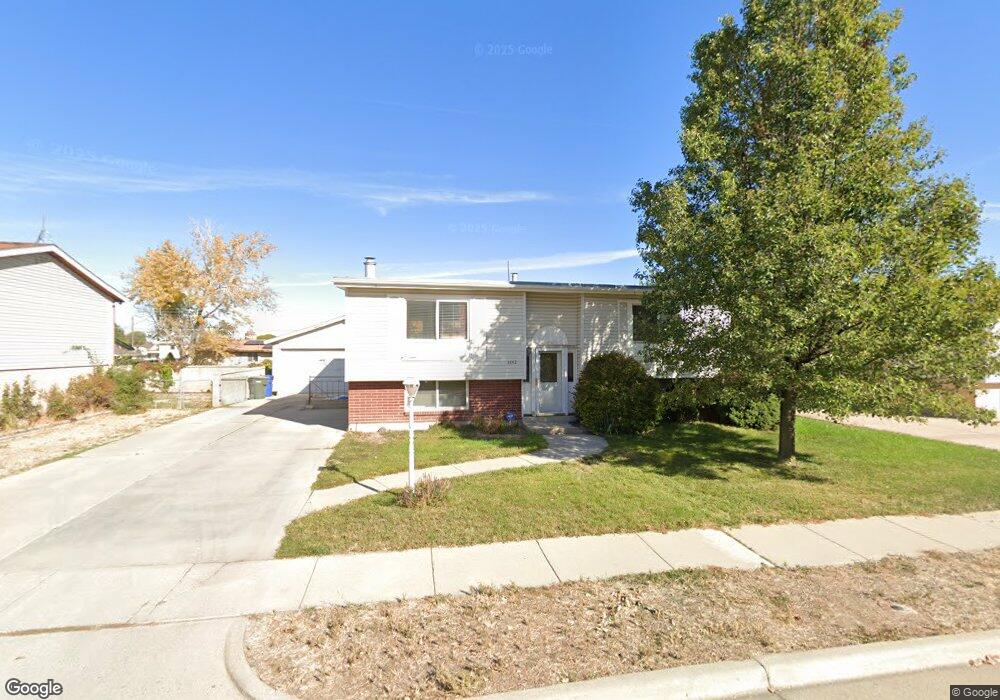
3442 Brett Ave Salt Lake City, UT 84119
Granger NeighborhoodEstimated Value: $412,000 - $450,000
3
Beds
2
Baths
1,894
Sq Ft
$231/Sq Ft
Est. Value
About This Home
This home is located at 3442 Brett Ave, Salt Lake City, UT 84119 and is currently estimated at $436,587, approximately $230 per square foot. 3442 Brett Ave is a home located in Salt Lake County with nearby schools including Pioneer Elementary School, Valley Junior High School, and Granger High School.
Ownership History
Date
Name
Owned For
Owner Type
Purchase Details
Closed on
Nov 21, 2005
Sold by
Johnson Arbra
Bought by
Carpentier Scott D
Current Estimated Value
Home Financials for this Owner
Home Financials are based on the most recent Mortgage that was taken out on this home.
Original Mortgage
$116,000
Outstanding Balance
$60,931
Interest Rate
5.37%
Mortgage Type
Purchase Money Mortgage
Estimated Equity
$375,656
Purchase Details
Closed on
Nov 16, 1998
Sold by
Johnson Arbra
Bought by
Johnson Arbra
Create a Home Valuation Report for This Property
The Home Valuation Report is an in-depth analysis detailing your home's value as well as a comparison with similar homes in the area
Home Values in the Area
Average Home Value in this Area
Purchase History
| Date | Buyer | Sale Price | Title Company |
|---|---|---|---|
| Carpentier Scott D | -- | Surety Title | |
| Johnson Arbra | -- | -- |
Source: Public Records
Mortgage History
| Date | Status | Borrower | Loan Amount |
|---|---|---|---|
| Open | Carpentier Scott D | $116,000 |
Source: Public Records
Tax History Compared to Growth
Tax History
| Year | Tax Paid | Tax Assessment Tax Assessment Total Assessment is a certain percentage of the fair market value that is determined by local assessors to be the total taxable value of land and additions on the property. | Land | Improvement |
|---|---|---|---|---|
| 2025 | $2,277 | $363,300 | $124,100 | $239,200 |
| 2024 | $2,277 | $348,900 | $117,600 | $231,300 |
| 2023 | $2,240 | $328,600 | $113,100 | $215,500 |
| 2022 | $2,040 | $300,000 | $110,900 | $189,100 |
| 2021 | $1,874 | $247,700 | $85,300 | $162,400 |
| 2020 | $1,727 | $215,500 | $75,400 | $140,100 |
| 2019 | $1,694 | $203,800 | $71,100 | $132,700 |
| 2018 | $1,709 | $198,200 | $71,100 | $127,100 |
| 2017 | $1,521 | $179,400 | $71,100 | $108,300 |
| 2016 | $1,346 | $159,000 | $71,100 | $87,900 |
| 2015 | $1,430 | $160,900 | $70,400 | $90,500 |
| 2014 | $1,404 | $154,800 | $68,300 | $86,500 |
Source: Public Records
Map
Nearby Homes
- 4014 S Peachwood Dr
- 3917 David Place
- 4093 Peachwood Dr
- 3308 W 4060 S
- 3228 W Meadow Leaf Ct
- 4080 S Bonniewood Dr
- 3780 S 3520 W
- 3664 W 3965 S
- 3761 S Oxford Way
- 3851 S 3200 W Unit 3855
- 3376 Sunnybrook Dr
- 3741 W 3830 S
- 3503 W Paiute Dr
- 3031 W 3875 S
- 3818 W Edgewater Cir
- 4115 S Middlepark Ln Unit 22
- 3533 W 3650 S Unit 3535
- 3035 W 3835 S
- 3916 S Hawkeye St
- 3018 W 4100 S