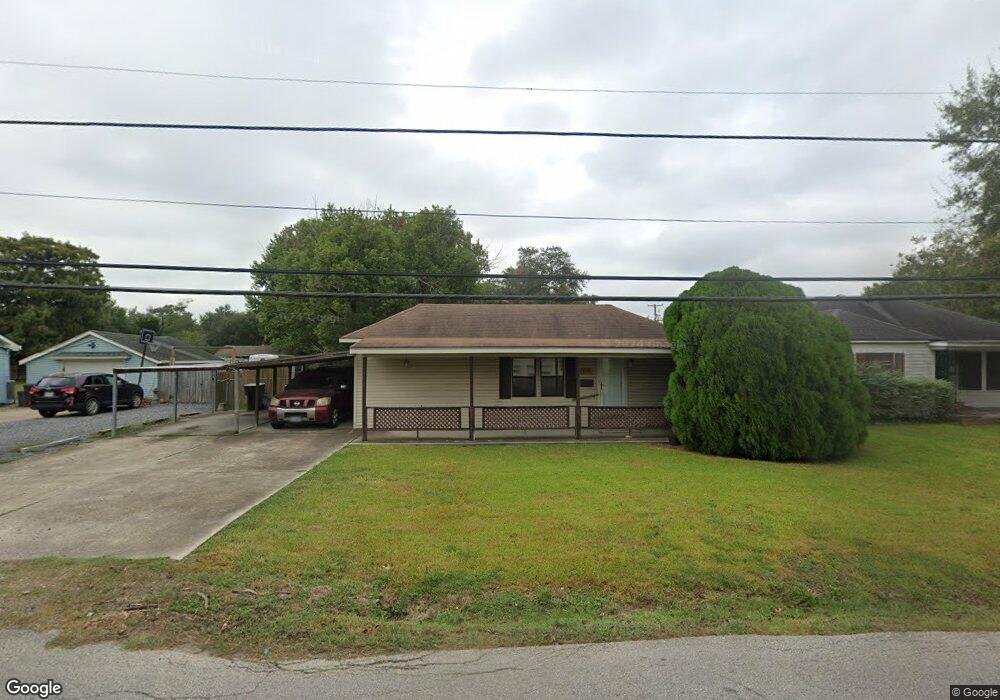
3443 39th St Port Arthur, TX 77642
Estimated Value: $74,000 - $117,000
2
Beds
1
Bath
828
Sq Ft
$114/Sq Ft
Est. Value
About This Home
This home is located at 3443 39th St, Port Arthur, TX 77642 and is currently estimated at $94,305, approximately $113 per square foot. 3443 39th St is a home located in Jefferson County with nearby schools including Houston Elementary School, Abraham Lincoln Middle School, and Memorial High School.
Ownership History
Date
Name
Owned For
Owner Type
Purchase Details
Closed on
Feb 2, 2017
Sold by
Onuoraii Emmanuel
Bought by
Valdez Oscar M
Current Estimated Value
Purchase Details
Closed on
Oct 26, 2016
Sold by
Abshire Mark and Abshire Phyllis F
Bought by
Onuorah Emmanuel
Purchase Details
Closed on
Jul 1, 2016
Sold by
Kester Krystena A and Gillaspie Raynette
Bought by
Abshire Mark and Abshire Phyllis F
Purchase Details
Closed on
Oct 26, 2012
Sold by
Abshire Mark Kirwin and Abshire Phyllis F
Bought by
Gillaspie Raynette
Home Financials for this Owner
Home Financials are based on the most recent Mortgage that was taken out on this home.
Original Mortgage
$30,000
Interest Rate
3.52%
Mortgage Type
Seller Take Back
Purchase Details
Closed on
Nov 19, 2009
Sold by
Kemp Jeanette
Bought by
Abshire Mark Kirwin and Abshire Phyllis F
Create a Home Valuation Report for This Property
The Home Valuation Report is an in-depth analysis detailing your home's value as well as a comparison with similar homes in the area
Home Values in the Area
Average Home Value in this Area
Purchase History
| Date | Buyer | Sale Price | Title Company |
|---|---|---|---|
| Valdez Oscar M | -- | Stewart Title | |
| Onuorah Emmanuel | -- | Stewart Title | |
| Abshire Mark | $30,000 | None Available | |
| Gillaspie Raynette | -- | None Available | |
| Abshire Mark Kirwin | -- | None Available |
Source: Public Records
Mortgage History
| Date | Status | Borrower | Loan Amount |
|---|---|---|---|
| Previous Owner | Gillaspie Raynette | $30,000 |
Source: Public Records
Tax History Compared to Growth
Tax History
| Year | Tax Paid | Tax Assessment Tax Assessment Total Assessment is a certain percentage of the fair market value that is determined by local assessors to be the total taxable value of land and additions on the property. | Land | Improvement |
|---|---|---|---|---|
| 2025 | $2,720 | $97,506 | $9,800 | $87,706 |
| 2024 | $2,720 | $94,954 | $4,116 | $90,838 |
| 2023 | $2,720 | $94,954 | $4,116 | $90,838 |
| 2022 | $2,419 | $76,160 | $4,116 | $72,044 |
| 2021 | $2,524 | $76,160 | $4,116 | $72,044 |
| 2020 | $1,320 | $39,833 | $4,116 | $35,717 |
| 2019 | $1,198 | $37,600 | $4,120 | $33,480 |
| 2018 | $1,269 | $39,810 | $4,120 | $35,690 |
| 2017 | $814 | $26,260 | $4,120 | $22,140 |
| 2016 | $769 | $26,260 | $4,120 | $22,140 |
| 2015 | -- | $26,260 | $4,120 | $22,140 |
| 2014 | -- | $26,260 | $4,120 | $22,140 |
Source: Public Records
Map
Nearby Homes
- 3801 7th Ave
- 3639 41st St
- 425 Rachel Ave
- 4201 Lansing Ave
- 4011 Everglades Ave
- 3721 Avalon Ave
- 4200 Lexington Ave
- 3836 Lexington Ave
- 3500 32nd St
- 3200 4th Ave
- 4034 32nd St
- 3812 30th St
- 3124 30th St
- 4433 & 4435 Neches Ave
- 3208 29th St
- 3425 Memorial Blvd
- 2715 35th St
- 3807 Platt Ave
- 2630 34th St
- 3930 Touraine Ave