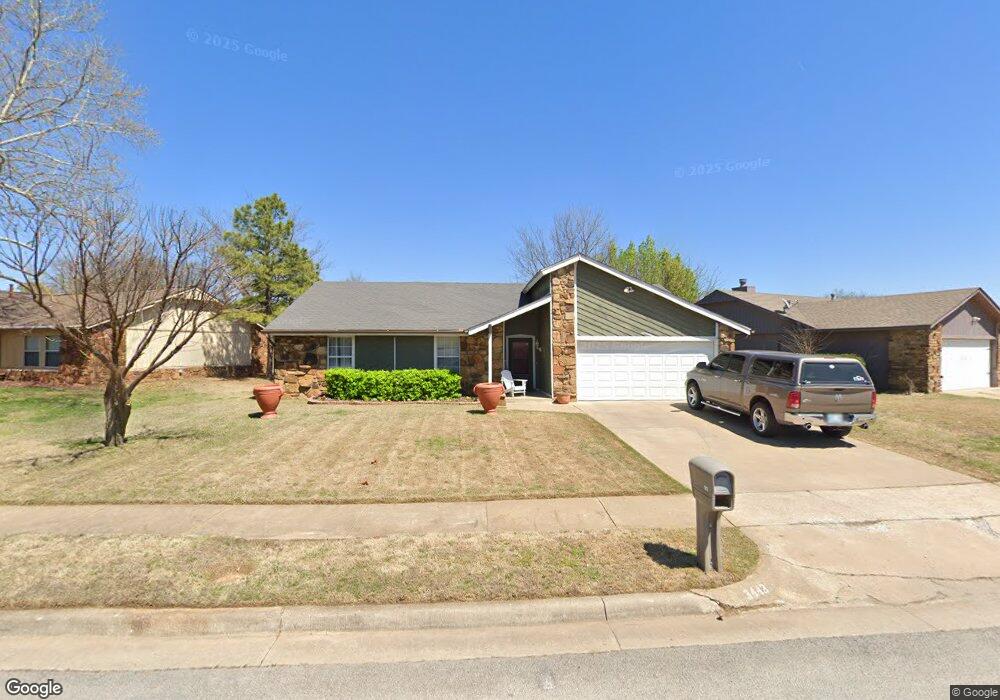
3443 S 148th East Ave Tulsa, OK 74134
Park Plaza East NeighborhoodEstimated Value: $193,000 - $220,000
--
Bed
2
Baths
1,482
Sq Ft
$138/Sq Ft
Est. Value
About This Home
This home is located at 3443 S 148th East Ave, Tulsa, OK 74134 and is currently estimated at $204,904, approximately $138 per square foot. 3443 S 148th East Ave is a home located in Tulsa County with nearby schools including Country Lane Primary Elementary School, Country Lane Intermediate School, and Centennial Middle School.
Ownership History
Date
Name
Owned For
Owner Type
Purchase Details
Closed on
Mar 11, 2015
Sold by
Soto Munoz Raul
Bought by
Soto Munoz Raul and Garcia Tavera Argelia
Current Estimated Value
Home Financials for this Owner
Home Financials are based on the most recent Mortgage that was taken out on this home.
Original Mortgage
$71,600
Outstanding Balance
$25,658
Interest Rate
3.6%
Mortgage Type
New Conventional
Estimated Equity
$179,246
Purchase Details
Closed on
Nov 26, 2003
Sold by
Woodward Ronald L and Woodward Tonya M
Bought by
Soto Munoz Raul
Home Financials for this Owner
Home Financials are based on the most recent Mortgage that was taken out on this home.
Original Mortgage
$85,325
Interest Rate
5.94%
Mortgage Type
FHA
Purchase Details
Closed on
Mar 12, 2003
Sold by
Woodward Ronald and Woodward Tonya
Bought by
Summers Robert B and Summers Gina L
Purchase Details
Closed on
Dec 1, 1991
Purchase Details
Closed on
Jun 1, 1985
Create a Home Valuation Report for This Property
The Home Valuation Report is an in-depth analysis detailing your home's value as well as a comparison with similar homes in the area
Home Values in the Area
Average Home Value in this Area
Purchase History
| Date | Buyer | Sale Price | Title Company |
|---|---|---|---|
| Soto Munoz Raul | -- | Oklahoma Land Title Svcs Llc | |
| Soto Munoz Raul | $86,000 | -- | |
| Summers Robert B | $45,000 | -- | |
| -- | $57,000 | -- | |
| -- | $57,000 | -- |
Source: Public Records
Mortgage History
| Date | Status | Borrower | Loan Amount |
|---|---|---|---|
| Open | Soto Munoz Raul | $71,600 | |
| Previous Owner | Soto Munoz Raul | $85,325 | |
| Closed | Soto Munoz Raul | $2,000 |
Source: Public Records
Tax History Compared to Growth
Tax History
| Year | Tax Paid | Tax Assessment Tax Assessment Total Assessment is a certain percentage of the fair market value that is determined by local assessors to be the total taxable value of land and additions on the property. | Land | Improvement |
|---|---|---|---|---|
| 2024 | $1,772 | $14,618 | $2,090 | $12,528 |
| 2023 | $1,772 | $13,922 | $2,027 | $11,895 |
| 2022 | $1,760 | $13,260 | $2,499 | $10,761 |
| 2021 | $1,693 | $12,628 | $2,380 | $10,248 |
| 2020 | $1,606 | $12,027 | $2,512 | $9,515 |
| 2019 | $1,586 | $11,454 | $2,392 | $9,062 |
| 2018 | $1,566 | $11,454 | $2,392 | $9,062 |
| 2017 | $1,523 | $11,161 | $2,331 | $8,830 |
| 2016 | $1,435 | $10,629 | $2,378 | $8,251 |
| 2015 | $1,370 | $10,124 | $2,265 | $7,859 |
| 2014 | $1,330 | $9,829 | $2,199 | $7,630 |
Source: Public Records
Map
Nearby Homes
- 3544 S 150th East Ave
- 15002 E 35th Place
- 15018 E 35th St
- 3907 S 150th East Ave
- 3320 S 144th East Ave
- 3720 S 150th East Ave
- 3352 S 143rd East Ave
- 3711 S 151st East Ave
- 3740 S 150th East Ave
- 3377 S 141st East Ave
- 14618 E 39th St S
- 3749 S 153rd East Ave
- 4006 S 149th East Ave
- 13801 E 33rd Place
- 14841 E 32nd St S
- 3352 S 138th East Ave
- 3363 S 137th East Ave
- Cleveland Plan at Battle Creek Park - Wellington Collection
- Carter Plan at Battle Creek Park - Wellington Collection
- Buchanon Plan at Battle Creek Park - Wellington Collection
- 3437 S 148th East Ave
- 3449 S 148th East Ave
- 3446 S 148th East Place
- 3429 S 148th East Ave
- 3444 S 148th East Place
- 3446 S 148th East Ave
- 3452 S 148th East Ave
- 3924 S 148th East Ave
- 3442 S 148th East Ave
- 3458 S 148th East Ave
- 3440 S 148th East Place
- 3436 S 148th Ave E
- 3425 S 148th East Ave
- 3451 S 148th East Place
- 3465 S 148th East Place
- 3432 S 148th East Ave
- 3469 S 148th East Place
- 3419 S 148th Ave
- 3447 S 148th East Place
- 3419 S 148th East Ave