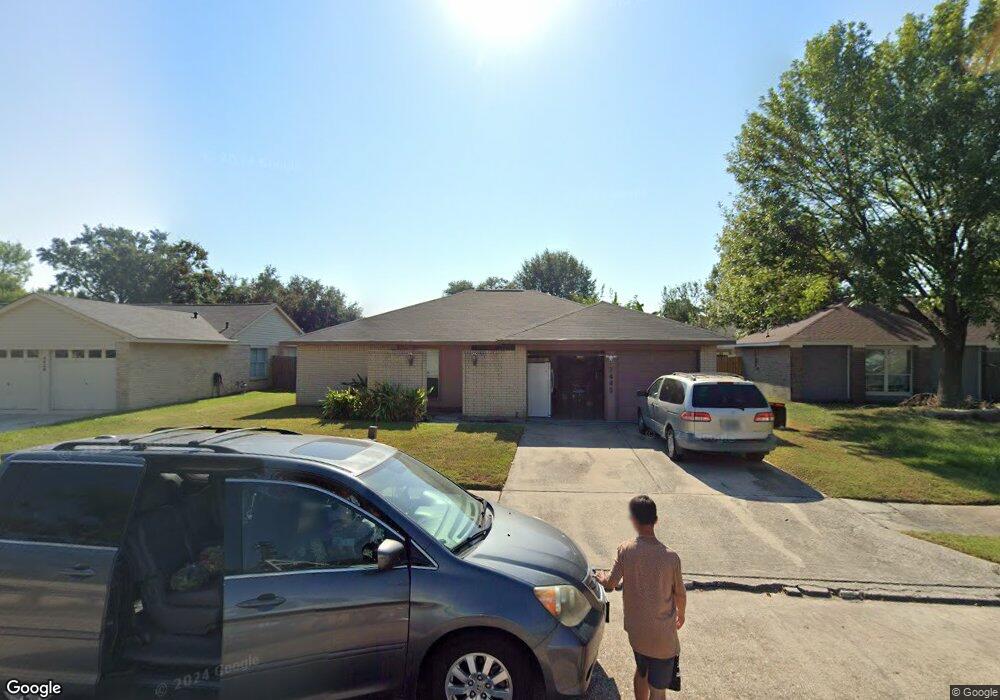
3443 Sandbrook Dr Houston, TX 77066
Champions NeighborhoodEstimated Value: $195,000 - $207,000
3
Beds
2
Baths
1,388
Sq Ft
$146/Sq Ft
Est. Value
About This Home
This home is located at 3443 Sandbrook Dr, Houston, TX 77066 and is currently estimated at $202,202, approximately $145 per square foot. 3443 Sandbrook Dr is a home located in Harris County with nearby schools including Griggs EC/PK/K, Conley Elementary School, and Plummer Middle School.
Ownership History
Date
Name
Owned For
Owner Type
Purchase Details
Closed on
Jun 13, 2017
Sold by
Tran Khanh Quoc and Trinh Kim Anh
Bought by
Vanvantruong Nan Van and Ngo Dein Thi
Current Estimated Value
Home Financials for this Owner
Home Financials are based on the most recent Mortgage that was taken out on this home.
Original Mortgage
$69,600
Outstanding Balance
$36,518
Interest Rate
4.02%
Mortgage Type
New Conventional
Estimated Equity
$165,684
Purchase Details
Closed on
Dec 23, 2010
Sold by
Vantruong Nan
Bought by
Tran Khanh Quoc and Trinh Kim Anh
Purchase Details
Closed on
Mar 9, 2010
Sold by
Ngo Phuong Kim
Bought by
Vantruong Nan
Purchase Details
Closed on
Dec 18, 1996
Sold by
Ngo Phen L and Vo Sai Thi
Bought by
Vanvantrinh Nan Van and Ngo Phuong K
Home Financials for this Owner
Home Financials are based on the most recent Mortgage that was taken out on this home.
Original Mortgage
$40,800
Interest Rate
7.73%
Mortgage Type
FHA
Create a Home Valuation Report for This Property
The Home Valuation Report is an in-depth analysis detailing your home's value as well as a comparison with similar homes in the area
Home Values in the Area
Average Home Value in this Area
Purchase History
| Date | Buyer | Sale Price | Title Company |
|---|---|---|---|
| Vanvantruong Nan Van | -- | None Available | |
| Tran Khanh Quoc | -- | None Available | |
| Vantruong Nan | -- | None Available | |
| Vanvantrinh Nan Van | -- | Regency Title |
Source: Public Records
Mortgage History
| Date | Status | Borrower | Loan Amount |
|---|---|---|---|
| Open | Vanvantruong Nan Van | $69,600 | |
| Previous Owner | Vanvantrinh Nan Van | $40,800 |
Source: Public Records
Tax History Compared to Growth
Tax History
| Year | Tax Paid | Tax Assessment Tax Assessment Total Assessment is a certain percentage of the fair market value that is determined by local assessors to be the total taxable value of land and additions on the property. | Land | Improvement |
|---|---|---|---|---|
| 2025 | $2,884 | $194,824 | $37,246 | $157,578 |
| 2024 | $2,884 | $195,605 | $37,246 | $158,359 |
| 2023 | $2,884 | $220,644 | $37,246 | $183,398 |
| 2022 | $3,818 | $165,000 | $24,504 | $140,496 |
| 2021 | $3,679 | $156,904 | $24,504 | $132,400 |
| 2020 | $3,637 | $141,731 | $24,504 | $117,227 |
| 2019 | $3,444 | $108,000 | $13,069 | $94,931 |
| 2018 | $1,192 | $107,987 | $13,069 | $94,918 |
| 2017 | $2,297 | $107,987 | $13,069 | $94,918 |
| 2016 | $2,088 | $107,987 | $13,069 | $94,918 |
| 2015 | $860 | $95,026 | $13,069 | $81,957 |
| 2014 | $860 | $66,099 | $13,069 | $53,030 |
Source: Public Records
Map
Nearby Homes
- 14207 Timberhaven Dr
- 3407 Sandbrook Dr
- 14118 Magnolia Springs Dr
- 14003 Valley Grove Dr
- 3230 Hombly Rd
- 11322 Yorklyn Dr
- 3519 Hombly Rd
- 11335 Chelsea Walk Dr
- 3240 Brownie Campbell Rd
- 11427 Valarno Dr
- 2606 Owens Cross Dr
- 13803 Bearwood Rd
- 3446 Cheaney Dr
- 2919 Sunwood Dr
- 12207 Mckamy Dr
- 10915 Meadow Walk Ln
- 12114 Mckamy Dr
- 2503 Hazyknoll Ln
- 2410 Irish Spring Dr
- 13610 Kaltenbrun Rd
- 3439 Sandbrook Dr
- 3447 Sandbrook Dr
- 3446 Garden Grove Dr
- 3442 Garden Grove Dr
- 3450 Garden Grove Dr
- 3435 Sandbrook Dr
- 3451 Sandbrook Dr
- 3442 Sandbrook Dr
- 3438 Garden Grove Dr
- 3454 Garden Grove Dr
- 3450 Sandbrook Dr
- 3431 Sandbrook Dr
- 3434 Sandbrook Dr
- 3455 Sandbrook Dr
- 3434 Garden Grove Dr
- 3458 Garden Grove Dr
- 3430 Sandbrook Dr
- 14131 Sandy Point Ln
- 14206 Cluster Pines Ct
- 3427 Sandbrook Dr