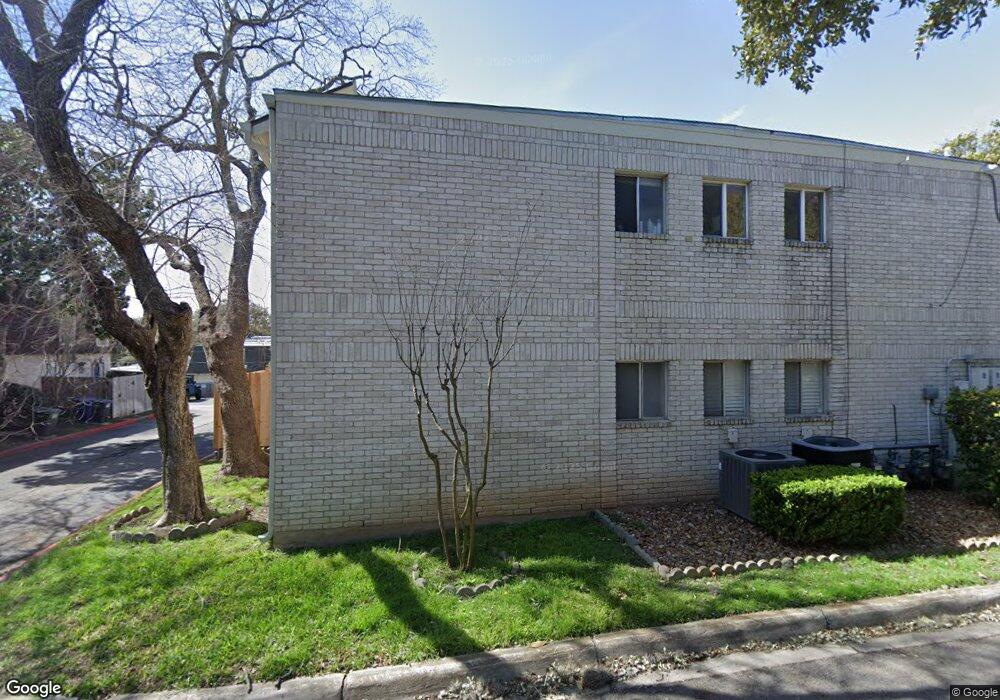
3443 Turtle Village St Unit FF94 San Antonio, TX 78230
Vance Jackson NeighborhoodEstimated Value: $171,000 - $191,000
2
Beds
2
Baths
1,382
Sq Ft
$130/Sq Ft
Est. Value
About This Home
This home is located at 3443 Turtle Village St Unit FF94, San Antonio, TX 78230 and is currently estimated at $179,279, approximately $129 per square foot. 3443 Turtle Village St Unit FF94 is a home located in Bexar County with nearby schools including Colonies North Elementary School, Hobby Middle School, and Clark High School.
Ownership History
Date
Name
Owned For
Owner Type
Purchase Details
Closed on
Jul 28, 2016
Sold by
Eliaz Evelyn and Eliaz Reuven
Bought by
Collins Pamela E
Current Estimated Value
Purchase Details
Closed on
Nov 10, 2014
Sold by
Rogers Teresa and Almendariz Fernando Michael
Bought by
Eliaz Evelyn
Home Financials for this Owner
Home Financials are based on the most recent Mortgage that was taken out on this home.
Original Mortgage
$90,824
Interest Rate
4.21%
Mortgage Type
FHA
Purchase Details
Closed on
Jan 11, 2013
Sold by
Turtle Creek Village Condominium Associa
Bought by
Rogers Teresa and Almendariz Teresa
Purchase Details
Closed on
Aug 5, 2009
Sold by
Rogers Teresa and Almendariz Teresa
Bought by
Turtle Creek Village Condominium Associa
Purchase Details
Closed on
Aug 2, 1994
Sold by
Stone Diana Lee
Bought by
Saenz Luis Javier
Create a Home Valuation Report for This Property
The Home Valuation Report is an in-depth analysis detailing your home's value as well as a comparison with similar homes in the area
Home Values in the Area
Average Home Value in this Area
Purchase History
| Date | Buyer | Sale Price | Title Company |
|---|---|---|---|
| Collins Pamela E | -- | Dhi Title | |
| Eliaz Evelyn | -- | Dhi Title | |
| Rogers Teresa | -- | None Available | |
| Turtle Creek Village Condominium Associa | $7,342 | None Available | |
| Saenz Luis Javier | -- | -- |
Source: Public Records
Mortgage History
| Date | Status | Borrower | Loan Amount |
|---|---|---|---|
| Previous Owner | Eliaz Evelyn | $90,824 |
Source: Public Records
Tax History Compared to Growth
Tax History
| Year | Tax Paid | Tax Assessment Tax Assessment Total Assessment is a certain percentage of the fair market value that is determined by local assessors to be the total taxable value of land and additions on the property. | Land | Improvement |
|---|---|---|---|---|
| 2025 | $2,560 | $173,000 | $21,190 | $151,810 |
| 2024 | $2,560 | $173,000 | $21,190 | $151,810 |
| 2023 | $2,560 | $169,000 | $21,190 | $147,810 |
| 2022 | $3,961 | $160,000 | $21,190 | $138,810 |
| 2021 | $3,979 | $155,220 | $21,190 | $134,030 |
| 2020 | $3,925 | $150,450 | $21,190 | $129,260 |
| 2019 | $3,861 | $144,120 | $21,190 | $122,930 |
| 2018 | $3,364 | $125,500 | $21,820 | $103,680 |
| 2017 | $2,976 | $110,830 | $21,820 | $89,010 |
| 2016 | $2,767 | $103,060 | $21,820 | $81,240 |
| 2015 | $2,177 | $94,440 | $21,820 | $72,620 |
| 2014 | $2,177 | $80,670 | $0 | $0 |
Source: Public Records
Map
Nearby Homes
- 3423 Northmoor St
- 3219 Castledale Dr
- 9203 Bingham Dr
- 9239 Bingham Dr
- 9107 Mellbrook St
- 9419 Powhatan Dr Unit 504
- 9419 Powhatan Dr Unit 502
- 3510 Rock Creek Run
- 3714 Litchfield Dr
- 3573 Red Oak Ln
- 3306 Fallen Leaf Ln
- 1209 Twisted Creek St
- 1233 Twisted Creek St
- 3114 Twisted Creek St
- 3422 William Penn Dr
- 9006 Luzita Ln
- 9223 Standing Creek
- 9838 Greentree St
- 9018 Foxland Dr
- 3323 Old Forge
- 3437 Turtle Village St
- 3437 Turtle Village St Unit 91
- 3441 Turtle Village St
- 3441 Turtle Village St Unit N/A
- 3439 Turtle Village St
- 3451 Turtle Village St
- 3451 Turtle Village St Unit 3451
- 3451 Turtle Village St Unit 97
- 3433 Turtle Village St
- 3429 Turtle Village St
- 3431 Turtle Village St
- 3431 Turtle Village St Unit 90
- 3451 Turtle Village Dr Unit 97
- 3451 Turtle Village Dr Unit 3451
- 3435 Turtle Village St
- 3435 Turtle Village St Unit 89
- 3445 Turtle Village St
- 3445 Turtle Village St Unit 96
- 3449 Turtle Village St
- 3449 Turtle Village St Unit 95