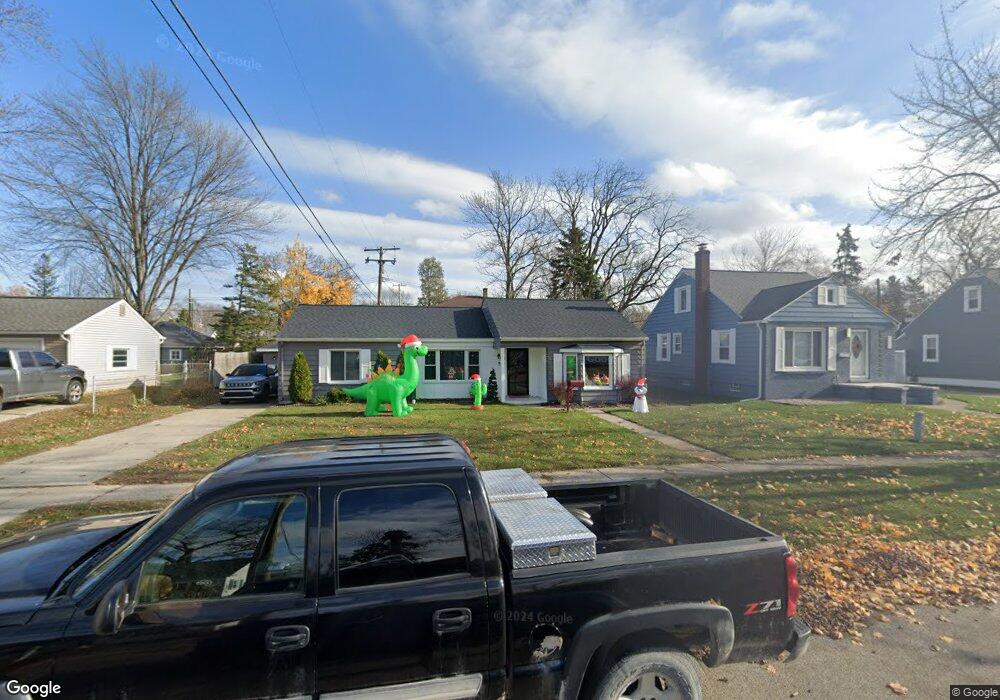
3444 Maple St Unit Bldg-Unit Port Huron, MI 48060
Estimated Value: $213,000 - $230,000
3
Beds
1
Bath
1,502
Sq Ft
$146/Sq Ft
Est. Value
About This Home
This home is located at 3444 Maple St Unit Bldg-Unit, Port Huron, MI 48060 and is currently estimated at $218,944, approximately $145 per square foot. 3444 Maple St Unit Bldg-Unit is a home located in St. Clair County with nearby schools including Garfield Elementary School, Holland Woods Middle School, and Port Huron Northern High School.
Ownership History
Date
Name
Owned For
Owner Type
Purchase Details
Closed on
Jul 18, 2025
Sold by
Newberry Mackenzie and Bucu Mackenzie
Bought by
Rodriguez Sydney
Current Estimated Value
Purchase Details
Closed on
Apr 3, 2024
Sold by
Head Charles
Bought by
Newberry Mackenzie and Bucu Dray
Purchase Details
Closed on
Feb 23, 2024
Sold by
Head Charles
Bought by
Newberry Mackenzie and Bucu Dray
Purchase Details
Closed on
Nov 12, 2021
Sold by
James Loxton
Bought by
Head Charles
Home Financials for this Owner
Home Financials are based on the most recent Mortgage that was taken out on this home.
Original Mortgage
$10,000
Interest Rate
3.11%
Purchase Details
Closed on
Sep 18, 2019
Sold by
Baker Joshua C
Bought by
Loxton James
Home Financials for this Owner
Home Financials are based on the most recent Mortgage that was taken out on this home.
Original Mortgage
$115,371
Interest Rate
3.6%
Mortgage Type
FHA
Purchase Details
Closed on
Sep 9, 2019
Sold by
Baker Joshua C
Bought by
Loxton James
Home Financials for this Owner
Home Financials are based on the most recent Mortgage that was taken out on this home.
Original Mortgage
$115,371
Interest Rate
3.6%
Mortgage Type
FHA
Purchase Details
Closed on
Mar 29, 2018
Sold by
Mcdonald Christina L
Bought by
Baker Joshua C
Purchase Details
Closed on
Dec 12, 2014
Sold by
Jones Stephen P and Jones Salli
Bought by
Mead Christina L
Home Financials for this Owner
Home Financials are based on the most recent Mortgage that was taken out on this home.
Original Mortgage
$73,542
Interest Rate
4.62%
Mortgage Type
FHA
Purchase Details
Closed on
Aug 16, 2011
Sold by
Flagstar Bank Fsb
Bought by
The Secretary Of Housing & Urban Develop
Purchase Details
Closed on
Feb 10, 2011
Sold by
Mugridge Daniel C and Mugridge Rachel E
Bought by
Flagstar Bank Fsb
Purchase Details
Closed on
Nov 3, 2006
Sold by
Mugridge Rachel E and Friedsberg Rachel E
Bought by
Mugridge Daniel C and Mugridge Rachel E
Home Financials for this Owner
Home Financials are based on the most recent Mortgage that was taken out on this home.
Original Mortgage
$110,500
Interest Rate
10.85%
Mortgage Type
Adjustable Rate Mortgage/ARM
Create a Home Valuation Report for This Property
The Home Valuation Report is an in-depth analysis detailing your home's value as well as a comparison with similar homes in the area
Home Values in the Area
Average Home Value in this Area
Purchase History
| Date | Buyer | Sale Price | Title Company |
|---|---|---|---|
| Rodriguez Sydney | $218,000 | Liberty Title | |
| Newberry Mackenzie | $180,000 | Liberty Title | |
| Newberry Mackenzie | $180,000 | Liberty Title | |
| Head Charles | $168,000 | Liberty Title | |
| Loxton James | $117,500 | Ata National Title Group | |
| Loxton James | $117,500 | Ata National Title Group | |
| Loxton James | $117,500 | Ata National Title | |
| Baker Joshua C | $97,600 | Liberty Title | |
| Mead Christina L | $74,900 | Liberty Title | |
| The Secretary Of Housing & Urban Develop | -- | None Available | |
| Flagstar Bank Fsb | $130,169 | None Available | |
| Mugridge Daniel C | $93,305 | Lenders First Choice |
Source: Public Records
Mortgage History
| Date | Status | Borrower | Loan Amount |
|---|---|---|---|
| Previous Owner | Head Charles | $10,000 | |
| Previous Owner | Head Charles | $164,957 | |
| Previous Owner | Loxton James | $115,371 | |
| Previous Owner | Loxton James | $115,371 | |
| Previous Owner | Mead Christina L | $73,542 | |
| Previous Owner | Mugridge Daniel C | $110,500 |
Source: Public Records
Tax History Compared to Growth
Tax History
| Year | Tax Paid | Tax Assessment Tax Assessment Total Assessment is a certain percentage of the fair market value that is determined by local assessors to be the total taxable value of land and additions on the property. | Land | Improvement |
|---|---|---|---|---|
| 2025 | $3,127 | $91,900 | $0 | $0 |
| 2024 | $2,710 | $91,700 | $0 | $0 |
| 2023 | $2,560 | $81,600 | $0 | $0 |
| 2022 | $2,747 | $61,000 | $0 | $0 |
| 2021 | $2,193 | $50,900 | $0 | $0 |
| 2020 | $2,218 | $48,900 | $48,900 | $0 |
| 2019 | $2,116 | $42,700 | $0 | $0 |
| 2018 | $1,636 | $42,700 | $0 | $0 |
| 2017 | $1,461 | $39,100 | $0 | $0 |
| 2016 | $1,248 | $39,100 | $0 | $0 |
| 2015 | $1,122 | $34,700 | $34,700 | $0 |
| 2014 | $1,122 | $31,800 | $31,800 | $0 |
| 2013 | -- | $30,800 | $0 | $0 |
Source: Public Records
Map
Nearby Homes
- 3455 Gratiot Ave
- 3321 Stone St
- 1020 Sanborn St
- 3214 Poplar St
- 1424 Hazelwood Ln
- 1202 Palmer Ct
- 2913 11th Ave
- 2927 Cooper Ave
- 1531 Robinson St
- 1434 Schumaker St
- 1218 Garfield St
- 3208 Mount Vernon Rd
- 1116 Hancock St
- 3419 Riverside Dr
- 2419 Cherry St
- 2431 Armour St
- 2400 Walnut St
- 2835 17th Ave
- 909 Elmwood St
- 2400 Stone St Unit 2414
- 3443 Cherry St
- 3448 Maple St
- 3434 Maple St
- 808 La Salle Blvd
- 3439 Cherry St
- 3433 Cherry St
- 3430 Maple St
- 802 La Salle Blvd
- 816 La Salle Blvd
- 808 Lasalle Blvd
- 3429 Cherry St
- 819 Edison Blvd
- 3439 Maple St
- 3440 Cherry St
- 3449 Maple St
- 3433 Maple St
- 3436 Cherry St
- 3431 Maple St
- 3444 Cherry St
- 3430 Cherry St