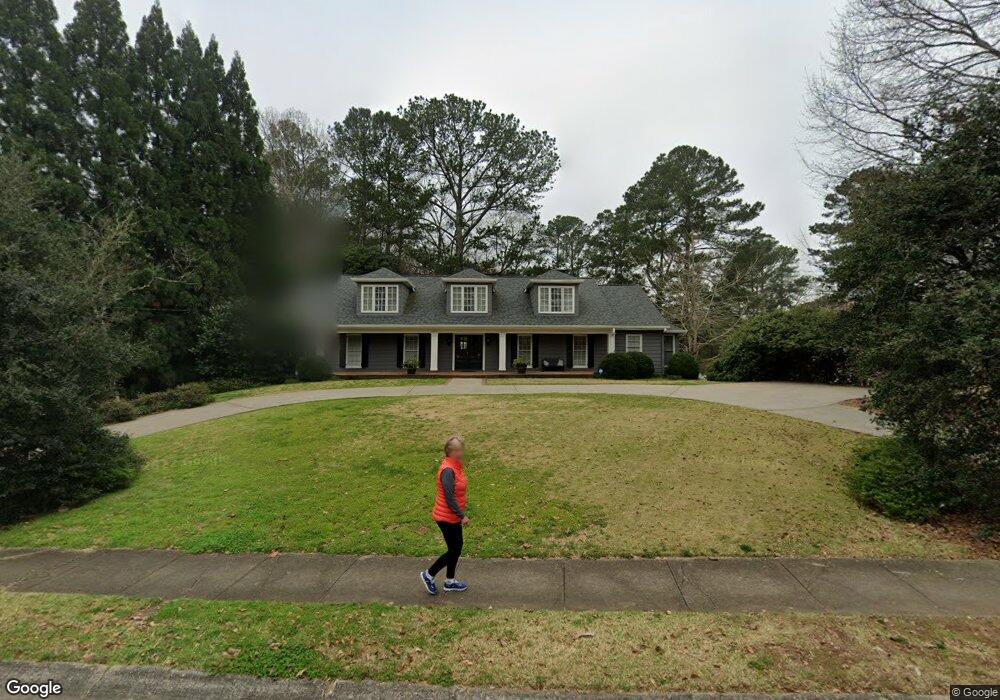
3444 Stratfield Dr NE Unit 3 Atlanta, GA 30319
Lakes District NeighborhoodEstimated Value: $889,598 - $987,000
3
Beds
3
Baths
3,710
Sq Ft
$255/Sq Ft
Est. Value
About This Home
This home is located at 3444 Stratfield Dr NE Unit 3, Atlanta, GA 30319 and is currently estimated at $944,400, approximately $254 per square foot. 3444 Stratfield Dr NE Unit 3 is a home located in DeKalb County with nearby schools including Montgomery Elementary School, Chamblee Middle School, and Dekalb Path Academy Charter School.
Ownership History
Date
Name
Owned For
Owner Type
Purchase Details
Closed on
May 6, 2014
Sold by
Nort John Frederick
Bought by
Nort Christine Homrich
Current Estimated Value
Purchase Details
Closed on
Dec 13, 2007
Sold by
Regions Bank
Bought by
Nort John F and Nort Christine H
Home Financials for this Owner
Home Financials are based on the most recent Mortgage that was taken out on this home.
Original Mortgage
$417,000
Interest Rate
6.15%
Mortgage Type
New Conventional
Purchase Details
Closed on
Jul 12, 1996
Sold by
Caulkins Glenn A Mary J
Bought by
Nort John F
Purchase Details
Closed on
Feb 7, 1994
Sold by
Zurcher Robert J Donna D
Bought by
Caulkins Glenn A Mary Jo
Home Financials for this Owner
Home Financials are based on the most recent Mortgage that was taken out on this home.
Original Mortgage
$191,700
Interest Rate
4.5%
Create a Home Valuation Report for This Property
The Home Valuation Report is an in-depth analysis detailing your home's value as well as a comparison with similar homes in the area
Home Values in the Area
Average Home Value in this Area
Purchase History
| Date | Buyer | Sale Price | Title Company |
|---|---|---|---|
| Nort Christine Homrich | -- | -- | |
| Nort John F | -- | -- | |
| Nort John F | $237,000 | -- | |
| Caulkins Glenn A Mary Jo | $213,000 | -- |
Source: Public Records
Mortgage History
| Date | Status | Borrower | Loan Amount |
|---|---|---|---|
| Previous Owner | Nort John F | $417,000 | |
| Previous Owner | Caulkins Glenn A Mary Jo | $191,700 | |
| Closed | Nort John F | $0 |
Source: Public Records
Tax History Compared to Growth
Tax History
| Year | Tax Paid | Tax Assessment Tax Assessment Total Assessment is a certain percentage of the fair market value that is determined by local assessors to be the total taxable value of land and additions on the property. | Land | Improvement |
|---|---|---|---|---|
| 2024 | $1,217 | $283,200 | $140,000 | $143,200 |
| 2023 | $1,217 | $266,480 | $140,000 | $126,480 |
| 2022 | $1,298 | $258,600 | $140,000 | $118,600 |
| 2021 | $1,362 | $241,920 | $100,000 | $141,920 |
| 2020 | $1,524 | $189,160 | $84,760 | $104,400 |
| 2019 | $1,511 | $220,680 | $84,760 | $135,920 |
| 2018 | $3,660 | $218,680 | $44,800 | $173,880 |
| 2017 | $2,211 | $218,680 | $44,800 | $173,880 |
| 2016 | $6,897 | $218,680 | $44,800 | $173,880 |
| 2014 | $5,510 | $164,920 | $44,800 | $120,120 |
Source: Public Records
Map
Nearby Homes
- 1524 Donaldson Park Dr NE
- 3561 Parkside Way
- 3577 Parkside Way
- 3283 Stratfield Dr NE
- 3480 Tanbark Ct NE
- 3692 Lambert Ln NE
- 1634 Canopy Chase NE
- 3708 Ashford Creek Hill NE
- 3743 Ashford Creek Ave NE
- 3745 Ashford Creek Ave NE
- 1359 Ragley Hall Rd NE
- 3643 Gambrell Ln NE
- 3430 Keswick Ct
- 3724 Ashford Creek Ln NE
- 2351 Johnson Ferry Rd NE
- 2365 Johnson Ferry Rd NE
- 3519 Sunderland Way NE
- 3366 Keswick Dr
- 3432 Stratfield Dr NE
- 1493 Epping Forest Dr NE
- 1502 Epping Forest Dr NE
- 3447 Stratfield Dr NE Unit 1
- 3424 Stratfield Dr NE
- 3439 Stratfield Dr NE
- 1486 Epping Forest Dr NE
- 3431 Stratfield Dr NE
- 3453 Stratfield Dr NE
- 3461 Stratfield Dr NE
- 1483 Epping Forest Dr NE
- 3414 Stratfield Dr NE Unit 1
- 3480 Stratfield Dr NE
- 3471 Stratfield Dr NE
- 3422 Stratfield Dr NE
- 1474 Epping Forest Dr NE
- 3479 Stratfield Dr NE
- 3406 Stratfield Dr NE
- 1473 Epping Forest Dr NE
- 3490 Stratfield Dr NE