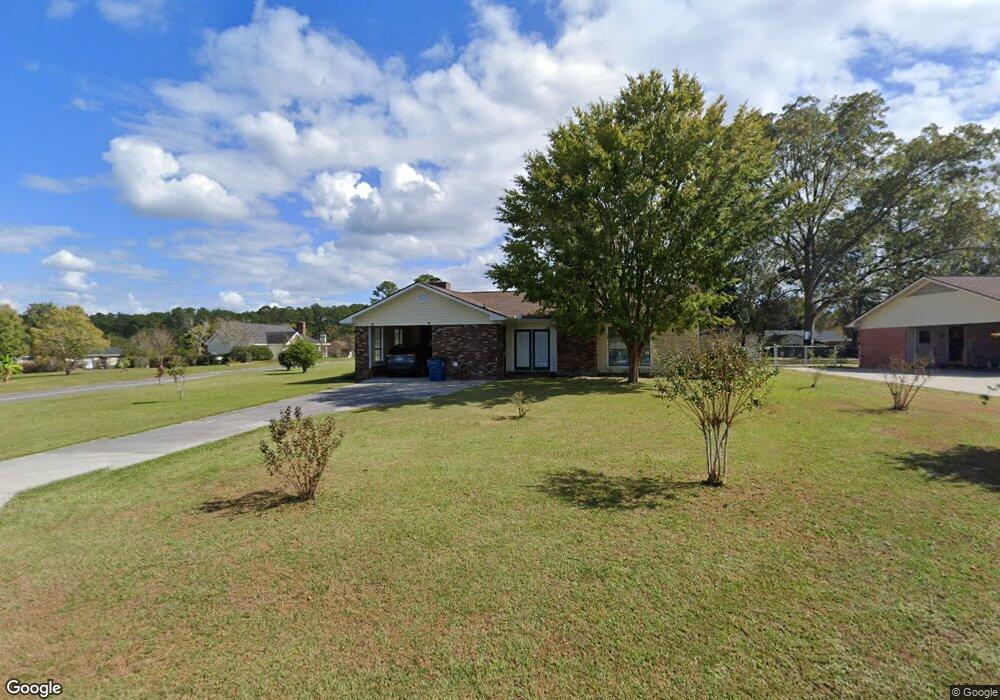
3448 Robin Ridge Waycross, GA 31503
Estimated Value: $231,723 - $282,000
3
Beds
3
Baths
2,230
Sq Ft
$117/Sq Ft
Est. Value
About This Home
This home is located at 3448 Robin Ridge, Waycross, GA 31503 and is currently estimated at $260,181, approximately $116 per square foot. 3448 Robin Ridge is a home located in Ware County with nearby schools including Williams Heights Elementary School, Waycross Middle School, and Ware County High School.
Ownership History
Date
Name
Owned For
Owner Type
Purchase Details
Closed on
Sep 27, 2006
Sold by
Tanner Teresa
Bought by
Rogers Ronnie D and Rogers Geraldine G
Current Estimated Value
Home Financials for this Owner
Home Financials are based on the most recent Mortgage that was taken out on this home.
Original Mortgage
$110,000
Outstanding Balance
$65,276
Interest Rate
6.36%
Mortgage Type
New Conventional
Estimated Equity
$194,905
Purchase Details
Closed on
Jun 19, 2006
Sold by
Gmac Mtg Corp
Bought by
Tanner Teresa
Purchase Details
Closed on
Mar 7, 2006
Sold by
Simmons Terry Lee
Bought by
Gmac Mortgage Corp
Purchase Details
Closed on
Aug 18, 2004
Sold by
Simmoms Terry Lee and Simmoms Tina
Bought by
Simmons Terry Lee
Purchase Details
Closed on
Nov 10, 1993
Bought by
Simmoms Terry Lee
Purchase Details
Closed on
Oct 27, 1992
Bought by
Grizzle Jane Y
Create a Home Valuation Report for This Property
The Home Valuation Report is an in-depth analysis detailing your home's value as well as a comparison with similar homes in the area
Home Values in the Area
Average Home Value in this Area
Purchase History
| Date | Buyer | Sale Price | Title Company |
|---|---|---|---|
| Rogers Ronnie D | $154,000 | -- | |
| Tanner Teresa | $85,500 | -- | |
| Gmac Mortgage Corp | $30,897 | -- | |
| Simmons Terry Lee | -- | -- | |
| Simmoms Terry Lee | $63,500 | -- | |
| Grizzle Jane Y | $7,500 | -- |
Source: Public Records
Mortgage History
| Date | Status | Borrower | Loan Amount |
|---|---|---|---|
| Open | Rogers Ronnie D | $110,000 |
Source: Public Records
Tax History Compared to Growth
Tax History
| Year | Tax Paid | Tax Assessment Tax Assessment Total Assessment is a certain percentage of the fair market value that is determined by local assessors to be the total taxable value of land and additions on the property. | Land | Improvement |
|---|---|---|---|---|
| 2024 | $1,440 | $90,275 | $3,219 | $87,056 |
| 2023 | $1,269 | $74,669 | $8,000 | $66,669 |
| 2022 | $1,615 | $73,706 | $8,000 | $65,706 |
| 2021 | $1,704 | $63,494 | $8,000 | $55,494 |
| 2020 | $1,667 | $60,050 | $8,000 | $52,050 |
| 2019 | $1,496 | $53,391 | $8,000 | $45,391 |
| 2018 | $1,440 | $51,248 | $8,000 | $43,248 |
| 2017 | $1,606 | $51,248 | $8,000 | $43,248 |
| 2016 | $1,606 | $51,248 | $8,000 | $43,248 |
| 2015 | $1,618 | $51,248 | $8,000 | $43,248 |
| 2014 | $1,614 | $51,248 | $8,000 | $43,248 |
| 2013 | -- | $51,248 | $8,000 | $43,248 |
Source: Public Records
Map
Nearby Homes
- 1132 Hilltop Rd
- 3817 Central Ave
- 3070 Central Ave
- 4155 Pinecrest Rd
- 867 Kentland Dr
- 2775 Seminole Trail
- 763 Kentland Dr
- 1072 Lawhorne Dr
- 1049 Riverdale Dr
- 630 Saddle Cir
- 606 Stonewall Jackson Place
- 3153 Southwood Dr
- 723 St Bernard Trail
- 664 Saddle Cir
- 627 Saddle Cir
- 851 Carriage Ln
- 955 Lynn Dr
- 47 +/- Acres Live Oak Ln
- 914 Barkley St
- 1622 Booth St
- 1162 Dove Dr
- 3443 Robin Ridge
- 1140 Dove Dr
- 3428 Robin Ridge
- 3464 Robin Ridge
- 3461 Robin Ridge
- 1133 Hilltop Rd
- 3456 Cypress Cir
- 3443 Lark Ridge
- 3464 Cypress Cir
- 3473 Robin Ridge
- 3461 Lark Ridge
- 3423 Robin Ridge
- 3423 Lark Ridge
- 3438 Cypress Cir
- 3478 Robin Ridge
- 3408 Robin Ridge
- 1164 Saint Ila Rd
- 1132 Hilltop Rd
- 3483 Robin Ridge