Estimated Value: $484,000 - $523,374
4
Beds
2
Baths
2,684
Sq Ft
$186/Sq Ft
Est. Value
About This Home
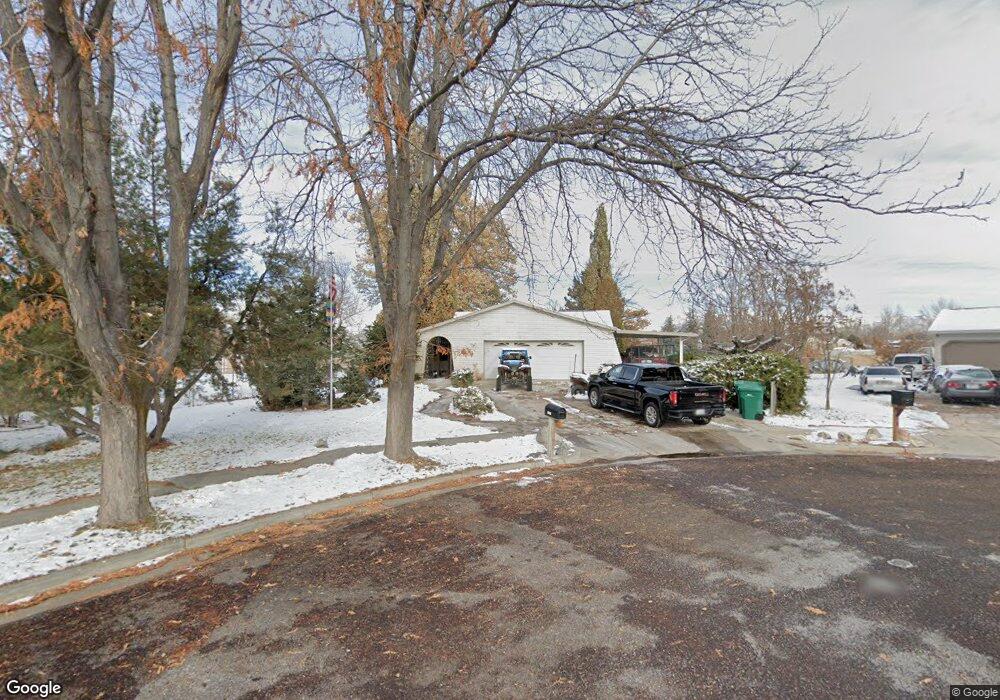
This home is located at 3448 W 5300 S, Roy, UT 84067 and is currently estimated at $498,594, approximately $185 per square foot. 3448 W 5300 S is a home located in Weber County with nearby schools including Roy Elementary School, Roy Junior High School, and Roy High School.
Ownership History
Date
Name
Owned For
Owner Type
Purchase Details
Closed on
Jun 6, 2016
Sold by
Lamont Gary and Jorgensen Cathy
Bought by
Klingenberg David R and Klingenberg Wendy R
Current Estimated Value
Home Financials for this Owner
Home Financials are based on the most recent Mortgage that was taken out on this home.
Original Mortgage
$239,000
Outstanding Balance
$190,773
Interest Rate
3.66%
Mortgage Type
VA
Estimated Equity
$307,821
Purchase Details
Closed on
Mar 19, 1997
Sold by
Poletti Lorene Doone
Bought by
Dickemore Delbert M and Dickemore Hazel M
Home Financials for this Owner
Home Financials are based on the most recent Mortgage that was taken out on this home.
Original Mortgage
$110,000
Interest Rate
7.56%
Create a Home Valuation Report for This Property
The Home Valuation Report is an in-depth analysis detailing your home's value as well as a comparison with similar homes in the area
Home Values in the Area
Average Home Value in this Area
Purchase History
| Date | Buyer | Sale Price | Title Company |
|---|---|---|---|
| Klingenberg David R | -- | Mountain View Title | |
| Dickemore Delbert M | -- | First American Title |
Source: Public Records
Mortgage History
| Date | Status | Borrower | Loan Amount |
|---|---|---|---|
| Open | Klingenberg David R | $239,000 | |
| Previous Owner | Dickemore Delbert M | $110,000 |
Source: Public Records
Tax History
| Year | Tax Paid | Tax Assessment Tax Assessment Total Assessment is a certain percentage of the fair market value that is determined by local assessors to be the total taxable value of land and additions on the property. | Land | Improvement |
|---|---|---|---|---|
| 2025 | $307 | $497,725 | $140,005 | $357,720 |
| 2024 | $3,114 | $268,949 | $77,002 | $191,947 |
| 2023 | $291 | $261,250 | $76,832 | $184,418 |
| 2022 | $275 | $255,750 | $63,251 | $192,499 |
| 2021 | $250 | $362,000 | $85,014 | $276,986 |
| 2020 | $229 | $319,000 | $85,014 | $233,986 |
| 2019 | $225 | $298,000 | $55,086 | $242,914 |
| 2018 | $2,067 | $256,000 | $50,061 | $205,939 |
| 2017 | $214 | $223,000 | $50,061 | $172,939 |
| 2016 | $1,691 | $107,459 | $24,743 | $82,716 |
| 2015 | $1,624 | $101,867 | $24,743 | $77,124 |
| 2014 | $1,652 | $101,867 | $24,743 | $77,124 |
Source: Public Records
Map
Nearby Homes
- 3443 W 5200 S Unit 2&3
- 5321 S 3100 W
- 5304 S 3100 W
- 3509 W 4835 S Unit 26
- 3517 W 4835 S Unit 27
- 3176 W 5625 S
- 3166 W 5625 S
- 5556 S 3800 W
- 5141 S 2975 W
- 5412 S 3925 W
- 3832 W 5625 S
- 3959 W 5325 S
- 5009 S 2925 W
- 5791 S 3260 W
- 5854 S 3500 W
- 5173 S 2825 W
- 4950 3900 West St
- 3826 W 5750 S
- 4813 S 3850 W
- 5444 S 4050 W
Your Personal Tour Guide
Ask me questions while you tour the home.