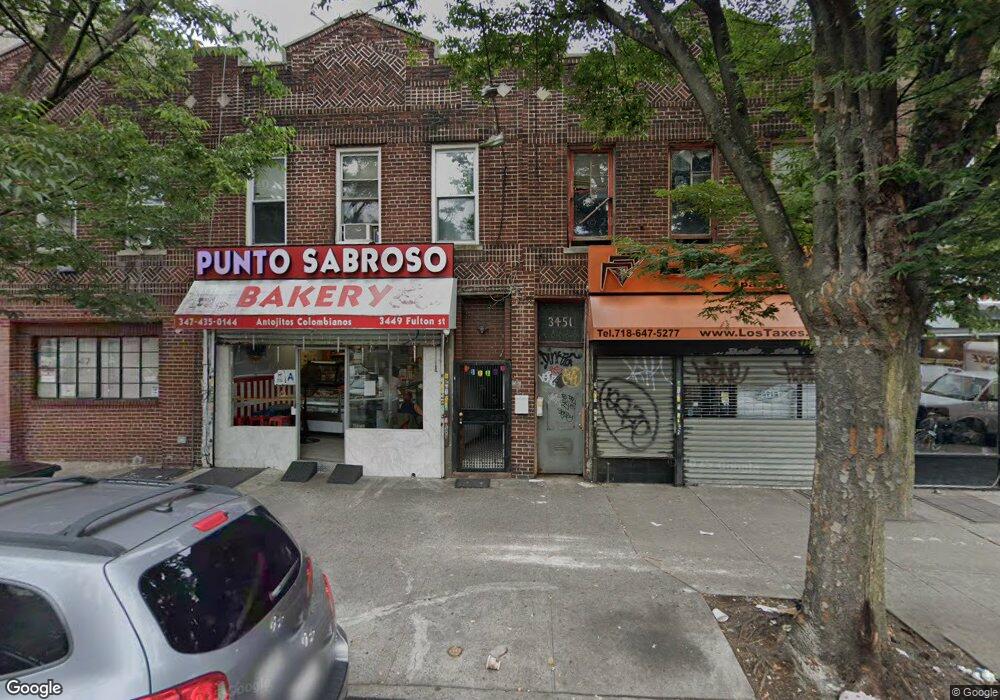
3449 Fulton St Brooklyn, NY 11208
Cypress Hills NeighborhoodEstimated Value: $671,424
--
Bed
--
Bath
2,318
Sq Ft
$290/Sq Ft
Est. Value
About This Home
This home is located at 3449 Fulton St, Brooklyn, NY 11208 and is currently estimated at $671,424, approximately $289 per square foot. 3449 Fulton St is a home located in Kings County with nearby schools including P.S. 7 - Abraham Lincoln, Westridge Elementary School, and Is 171 Abraham Lincoln.
Ownership History
Date
Name
Owned For
Owner Type
Purchase Details
Closed on
Oct 21, 2015
Sold by
Lewis Bryan
Bought by
Gan En Llc
Current Estimated Value
Purchase Details
Closed on
Nov 21, 2013
Sold by
Ramnarain Yoganand
Bought by
Lewis Bryan
Purchase Details
Closed on
Jan 17, 2006
Sold by
Ramlall Krishna D
Bought by
Trans Continental Realty Group
Purchase Details
Closed on
Aug 18, 2005
Sold by
Mangroo Sharon
Bought by
Ramlall Krishna D
Purchase Details
Closed on
Feb 20, 1997
Sold by
Jagdat Maheswar Narine and Narain Ganesh
Bought by
Deonarine Indira and Chattergoon Melvina
Home Financials for this Owner
Home Financials are based on the most recent Mortgage that was taken out on this home.
Original Mortgage
$155,250
Interest Rate
7.77%
Mortgage Type
FHA
Purchase Details
Closed on
Aug 3, 1994
Sold by
Jagdat Maheswarie Narain and Narain Maheswarie
Bought by
Jagdat Maheswarie Narain and Narain Ganesh
Create a Home Valuation Report for This Property
The Home Valuation Report is an in-depth analysis detailing your home's value as well as a comparison with similar homes in the area
Home Values in the Area
Average Home Value in this Area
Purchase History
| Date | Buyer | Sale Price | Title Company |
|---|---|---|---|
| Gan En Llc | $475,000 | -- | |
| Gan En Llc | $475,000 | -- | |
| Gan En Llc | $475,000 | -- | |
| Lewis Bryan | $375,000 | -- | |
| Lewis Bryan | $375,000 | -- | |
| Trans Continental Realty Group | $410,000 | -- | |
| Trans Continental Realty Group | $410,000 | -- | |
| Ramlall Krishna D | -- | -- | |
| Ramlall Krishna D | -- | -- | |
| Deonarine Indira | $155,000 | -- | |
| Deonarine Indira | $155,000 | -- | |
| Jagdat Maheswarie Narain | -- | Commonwealth Land Title Ins | |
| Jagdat Maheswarie Narain | -- | Commonwealth Land Title Ins |
Source: Public Records
Mortgage History
| Date | Status | Borrower | Loan Amount |
|---|---|---|---|
| Previous Owner | Deonarine Indira | $155,250 |
Source: Public Records
Tax History Compared to Growth
Tax History
| Year | Tax Paid | Tax Assessment Tax Assessment Total Assessment is a certain percentage of the fair market value that is determined by local assessors to be the total taxable value of land and additions on the property. | Land | Improvement |
|---|---|---|---|---|
| 2025 | $4,980 | $43,680 | $10,500 | $33,180 |
| 2024 | $4,980 | $43,200 | $10,500 | $32,700 |
| 2023 | $5,036 | $46,680 | $10,500 | $36,180 |
| 2022 | $4,699 | $40,080 | $10,500 | $29,580 |
| 2021 | $4,674 | $35,160 | $10,500 | $24,660 |
| 2020 | $2,192 | $37,200 | $10,500 | $26,700 |
| 2019 | $4,323 | $32,340 | $10,500 | $21,840 |
| 2018 | $4,212 | $20,664 | $8,054 | $12,610 |
| 2017 | $3,999 | $19,617 | $8,193 | $11,424 |
| 2016 | $3,700 | $18,507 | $9,280 | $9,227 |
| 2015 | $2,597 | $17,460 | $10,500 | $6,960 |
| 2014 | $2,597 | $17,220 | $10,500 | $6,720 |
Source: Public Records
Map
Nearby Homes
- 3450 Fulton St
- 229 Nichols Ave
- 3440 Fulton St
- 3434 Fulton St
- 199 Lincoln Ave
- 197 Nichols Ave
- 273 Grant Ave
- 182 Lincoln Ave
- 197 Grant Ave
- 191 Grant Ave
- 304 Grant Ave
- 236 Autumn Ave
- 285 Lincoln Ave
- 310 Eldert Ln
- 235 Hemlock St
- 310 Eldert Ln
- 74-25 93rd Ave
- 294 Autumn Ave
- 477 Ridgewood Ave
- 134 Lincoln Ave
- 3451 Fulton St
- 3447 Fulton St
- 3455 Fulton St
- 3443 Fulton St Unit 1
- 3443 Fulton St Unit 2F
- 3443 Fulton St Unit 3R
- 3443 Fulton St
- 3457 Fulton St
- 233 Nichols Ave
- 235 Nichols Ave
- 3441 Fulton St
- 231 Nichols Ave
- 3459 Fulton St
- 227 Nichols Ave
- 232 Grant Ave
- 232 Grant Ave Unit DE
- 3461-3469 Fulton St
- 225 Nichols Ave
- 230 Grant Ave
- 230 Grant Ave Unit DE