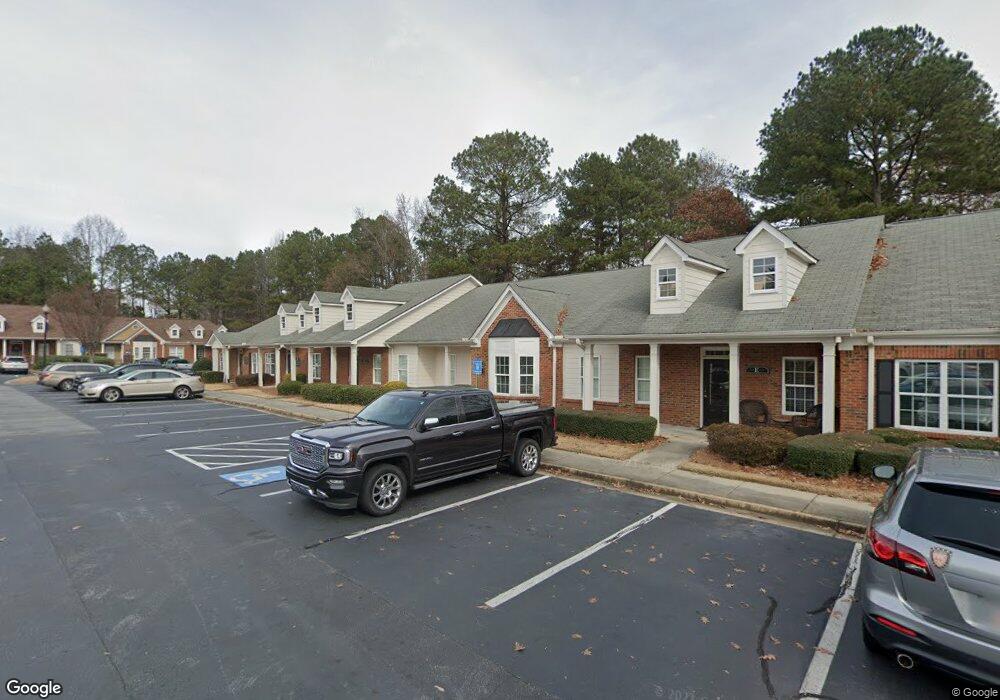
3449 Lawrenceville Suwanee Rd Unit SUITE 3449 C Suwanee, GA 30024
Estimated Value: $266,260
--
Bed
--
Bath
1,176
Sq Ft
$226/Sq Ft
Est. Value
About This Home
This home is located at 3449 Lawrenceville Suwanee Rd Unit SUITE 3449 C, Suwanee, GA 30024 and is currently estimated at $266,260, approximately $226 per square foot. 3449 Lawrenceville Suwanee Rd Unit SUITE 3449 C is a home located in Gwinnett County with nearby schools including Suwanee Elementary School, North Gwinnett Middle School, and North Gwinnett High School.
Ownership History
Date
Name
Owned For
Owner Type
Purchase Details
Closed on
Jul 28, 2020
Sold by
William Realty Llc
Bought by
Alsc Holdings Llc
Current Estimated Value
Home Financials for this Owner
Home Financials are based on the most recent Mortgage that was taken out on this home.
Original Mortgage
$127,200
Outstanding Balance
$86,806
Interest Rate
3%
Mortgage Type
Commercial
Estimated Equity
$179,454
Purchase Details
Closed on
Mar 15, 2017
Sold by
Gsg Holdings Grp Llc
Bought by
Willian Realty Llc
Purchase Details
Closed on
Oct 31, 2014
Sold by
Lbk Investments Llc
Bought by
Gsg Holding Grp Llc
Purchase Details
Closed on
Aug 27, 2004
Sold by
George Towne Square Llc
Bought by
Suits Donald F
Home Financials for this Owner
Home Financials are based on the most recent Mortgage that was taken out on this home.
Original Mortgage
$125,530
Interest Rate
6.01%
Mortgage Type
New Conventional
Create a Home Valuation Report for This Property
The Home Valuation Report is an in-depth analysis detailing your home's value as well as a comparison with similar homes in the area
Home Values in the Area
Average Home Value in this Area
Purchase History
| Date | Buyer | Sale Price | Title Company |
|---|---|---|---|
| Alsc Holdings Llc | $159,000 | -- | |
| Willian Realty Llc | $132,500 | -- | |
| Gsg Holding Grp Llc | $89,650 | -- | |
| Suits Donald F | $144,500 | -- |
Source: Public Records
Mortgage History
| Date | Status | Borrower | Loan Amount |
|---|---|---|---|
| Open | Alsc Holdings Llc | $127,200 | |
| Previous Owner | Suits Donald F | $125,530 |
Source: Public Records
Tax History Compared to Growth
Tax History
| Year | Tax Paid | Tax Assessment Tax Assessment Total Assessment is a certain percentage of the fair market value that is determined by local assessors to be the total taxable value of land and additions on the property. | Land | Improvement |
|---|---|---|---|---|
| 2025 | $2,541 | $80,400 | $400 | $80,000 |
| 2024 | $2,573 | $80,400 | $400 | $80,000 |
| 2023 | $2,573 | $80,400 | $400 | $80,000 |
| 2022 | $405 | $64,000 | $400 | $63,600 |
| 2021 | $2,111 | $55,960 | $11,200 | $44,760 |
| 2020 | $2,125 | $55,960 | $11,200 | $44,760 |
| 2019 | $1,844 | $55,960 | $11,200 | $44,760 |
| 2018 | $1,755 | $53,000 | $11,200 | $41,800 |
| 2016 | $1,587 | $48,000 | $12,720 | $35,280 |
| 2015 | $1,203 | $35,880 | $12,720 | $23,160 |
| 2014 | $1,652 | $48,960 | $10,812 | $38,148 |
Source: Public Records
Map
Nearby Homes
- 3540 Pierce Arrow Cir Unit 2
- 3375 Pierce Arrow Cir Unit 3
- 548 Myrtle Trace Ln
- 588 Myrtle Trace Ln
- 69 New Brunswick Ct Unit 1
- 841 Woodvale Point
- 821 Woodvale Point
- 377 Danville Ave
- 900 Woodvale Point
- 3690 Smithtown Rd
- 610 Golden Meadows Ln
- 0 Mohawk Trail Unit 7688155
- 0 Mohawk Trail Unit 10652266
- 655 Golden Meadows Ln
- 3779 Lawrenceville Suwanee
- 3355 Smithtown Rd
- 3265 Smithtown Rd Unit LOT 4
- 3275 Smithtown Rd
- 3255 Smithtown Rd Unit LOT 3
- 3240 Smithtown Rd
- 3449 Lawrenceville Suwanee Rd Unit C
- 3449 Lawrenceville Suwanee Rd
- 3449 Lawrenceville Suwanee Rd Unit B
- 3449 Lawrenceville-Suwanee Rd Unit C
- 3449 Lawrenceville Suwanee Rd Unit D
- 3449 E Lwrncvl Suwanee Rd
- 3449 Lawrenceville-Suwanee Rd Unit 3449 C
- 3449 Lawrenceville-Suwanee Rd
- 3449 Lawrenceville-Suwanee Rd Unit SUITE C
- 3449 Lawrenceville-Suwanee Rd Unit C
- 3449c Lawrenceville-Suwanee Rd Unit C
- 3449 Lawrenceville-Suwanee Rd Unit OFFICE FOR RENT
- 260 Deville Cir
- 265 Deville Cir Unit 4
- 3461 Lawrenceville Suwanee Rd Unit A
- 3461 Lawrenceville Suwanee Rd
- 3455 Lawrenceville-Suwanee Rd
- 3453 Lawrenceville-Suwanee Rd Unit D
- 3453 Lawrenceville-Suwanee Rd Unit C
- 3453 Lawrenceville-Suwanee Rd