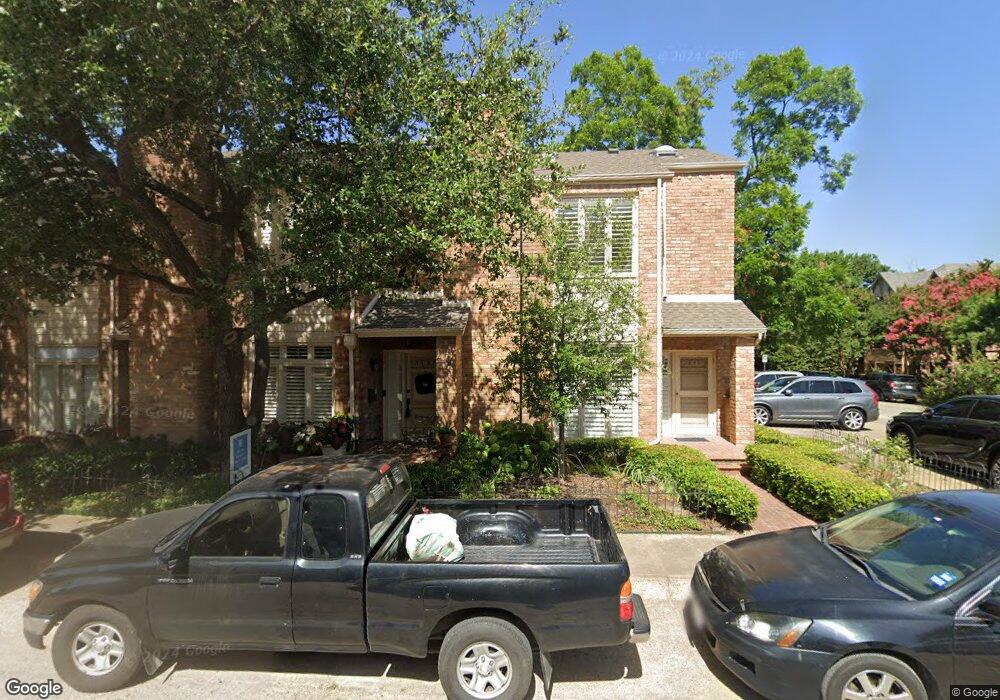
3449A Rankin St Unit 1 Dallas, TX 75205
Estimated Value: $498,000 - $721,000
2
Beds
2
Baths
1,242
Sq Ft
$463/Sq Ft
Est. Value
About This Home
This home is located at 3449A Rankin St Unit 1, Dallas, TX 75205 and is currently estimated at $575,655, approximately $463 per square foot. 3449A Rankin St Unit 1 is a home located in Dallas County with nearby schools including University Park Elementary School, Mcculloch Intermediate School, and Highland Park Middle School.
Ownership History
Date
Name
Owned For
Owner Type
Purchase Details
Closed on
Oct 20, 2014
Sold by
Kimball Catherine
Bought by
Casas De Clark Llc
Current Estimated Value
Purchase Details
Closed on
Apr 26, 2013
Sold by
Sweeny David Forsyth
Bought by
Kimball Catherine
Purchase Details
Closed on
Feb 11, 2005
Sold by
Puckett John and Puckett Elizabeth
Bought by
Sweeney David Forsyth
Home Financials for this Owner
Home Financials are based on the most recent Mortgage that was taken out on this home.
Original Mortgage
$187,200
Interest Rate
5.82%
Mortgage Type
Purchase Money Mortgage
Purchase Details
Closed on
Nov 1, 2000
Sold by
Coale David S and Coale Margarita
Bought by
Puckett John and Puckett Elizabeth
Home Financials for this Owner
Home Financials are based on the most recent Mortgage that was taken out on this home.
Original Mortgage
$148,000
Interest Rate
7.9%
Create a Home Valuation Report for This Property
The Home Valuation Report is an in-depth analysis detailing your home's value as well as a comparison with similar homes in the area
Home Values in the Area
Average Home Value in this Area
Purchase History
| Date | Buyer | Sale Price | Title Company |
|---|---|---|---|
| Casas De Clark Llc | -- | None Available | |
| Kimball Catherine | -- | Rtt | |
| Sweeney David Forsyth | -- | Rtt | |
| Puckett John | -- | -- |
Source: Public Records
Mortgage History
| Date | Status | Borrower | Loan Amount |
|---|---|---|---|
| Previous Owner | Sweeney David Forsyth | $187,200 | |
| Previous Owner | Puckett John | $148,000 | |
| Closed | Sweeney David Forsyth | $46,800 |
Source: Public Records
Tax History Compared to Growth
Tax History
| Year | Tax Paid | Tax Assessment Tax Assessment Total Assessment is a certain percentage of the fair market value that is determined by local assessors to be the total taxable value of land and additions on the property. | Land | Improvement |
|---|---|---|---|---|
| 2025 | $6,406 | $393,000 | $224,620 | $168,380 |
| 2024 | $6,406 | $393,000 | $224,620 | $168,380 |
| 2023 | $6,406 | $336,000 | $215,980 | $120,020 |
| 2022 | $6,362 | $336,000 | $215,980 | $120,020 |
| 2021 | $6,760 | $336,000 | $215,980 | $120,020 |
| 2020 | $7,024 | $341,550 | $215,980 | $125,570 |
| 2019 | $7,300 | $341,550 | $215,980 | $125,570 |
| 2018 | $5,762 | $273,240 | $138,230 | $135,010 |
| 2017 | $5,618 | $273,240 | $138,230 | $135,010 |
| 2016 | $5,618 | $273,240 | $120,950 | $152,290 |
| 2015 | $5,479 | $273,240 | $120,950 | $152,290 |
| 2014 | $5,479 | $267,030 | $103,670 | $163,360 |
Source: Public Records
Map
Nearby Homes
- 3420 Milton Ave Unit A
- 3241 Rankin St
- 3400 Amherst Ave
- 3233 Rankin St
- 3341 Stanford Ave
- 3204 Westminster Ave
- 6715 Golf Dr
- 3224 Amherst Ave
- 7031 Turtle Creek Blvd
- 3548 Mcfarlin Blvd
- 3626 University Blvd
- 6625 Golf Dr
- 3408 Hanover St
- 3400 Hanover St
- 3649 Haynie Ave
- 3529 Mcfarlin Blvd
- 3435 Asbury St
- 3423 Asbury St
- 3605 Mcfarlin Blvd
- 3121 Amherst Ave
- 3449A Rankin St Unit 2
- 3449A Rankin St Unit 3449
- 3449A Rankin St Unit 3
- 3439 Rankin St Unit 1
- 3439 Rankin St Unit 3439
- 3437 Rankin St Unit 1
- 3435 Rankin St Unit 3435
- 3433A Rankin St Unit 3433
- 3433 Rankin St
- 3445 Rankin St Unit 1
- 3441 Rankin St Unit 1
- 3443 Rankin St Unit 1
- 3445 Rankin St Unit 1
- 3441 Rankin St Unit 1
- 3443 Rankin St Unit 1
- 3441 Rankin St Unit A
- 3441 Rankin St Unit 3441
- 3443 Rankin St Unit 3443A
- 3445 Rankin St
- 3445 Rankin St Unit 3445