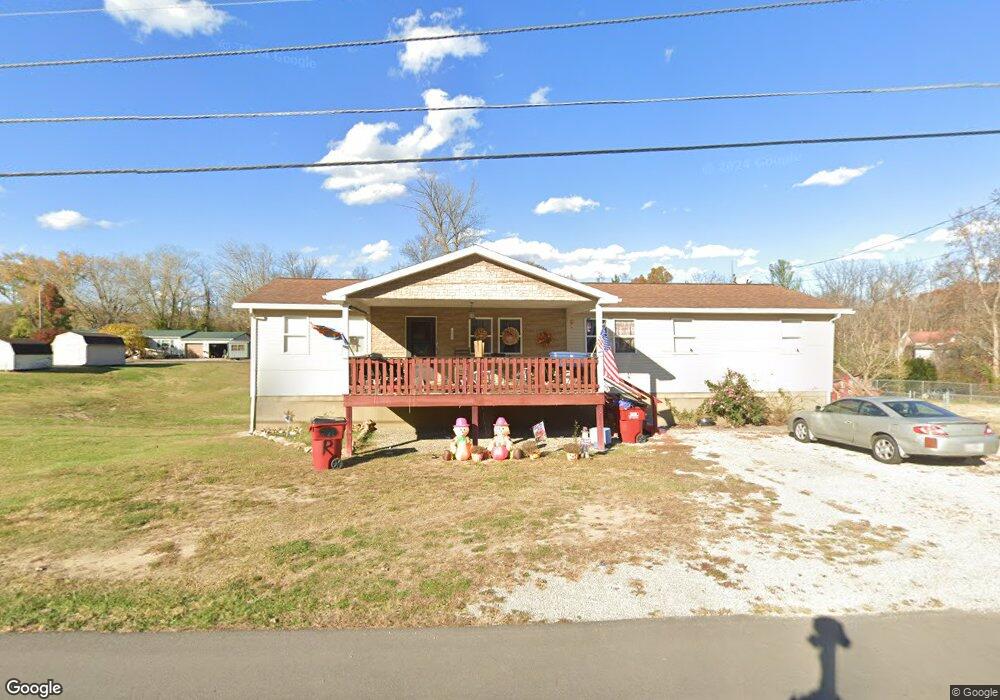
345 Barker St Mc Dermott, OH 45652
Estimated Value: $59,000 - $215,000
3
Beds
2
Baths
1,560
Sq Ft
$88/Sq Ft
Est. Value
About This Home
This home is located at 345 Barker St, Mc Dermott, OH 45652 and is currently estimated at $137,000, approximately $87 per square foot. 345 Barker St is a home located in Scioto County with nearby schools including Northwest Elementary School, Northwest Middle School, and Northwest High School.
Ownership History
Date
Name
Owned For
Owner Type
Purchase Details
Closed on
Mar 10, 2022
Sold by
Wolfe Dorthy Dianna
Bought by
Wolfe Dorthy Dianna
Current Estimated Value
Home Financials for this Owner
Home Financials are based on the most recent Mortgage that was taken out on this home.
Original Mortgage
$89,540
Outstanding Balance
$83,593
Interest Rate
3.85%
Mortgage Type
FHA
Estimated Equity
$53,407
Purchase Details
Closed on
Apr 5, 2021
Bought by
D Dianna Wolfe
Purchase Details
Closed on
Aug 12, 1999
Bought by
Eichenlaub Randy Ray
Purchase Details
Closed on
Mar 5, 1999
Sold by
Cyrus Francis
Bought by
Cyrus Elmo
Purchase Details
Closed on
Jan 25, 1996
Sold by
Cyrus Francis + Helen
Bought by
Cyrus Francis
Create a Home Valuation Report for This Property
The Home Valuation Report is an in-depth analysis detailing your home's value as well as a comparison with similar homes in the area
Home Values in the Area
Average Home Value in this Area
Purchase History
| Date | Buyer | Sale Price | Title Company |
|---|---|---|---|
| Wolfe Dorthy Dianna | $10,500 | -- | |
| D Dianna Wolfe | -- | -- | |
| Eichenlaub Randy Ray | $10,000 | -- | |
| Cyrus Elmo | -- | -- | |
| Cyrus Francis | -- | -- |
Source: Public Records
Mortgage History
| Date | Status | Borrower | Loan Amount |
|---|---|---|---|
| Open | Wolfe Dorthy Dianna | $89,540 |
Source: Public Records
Tax History Compared to Growth
Tax History
| Year | Tax Paid | Tax Assessment Tax Assessment Total Assessment is a certain percentage of the fair market value that is determined by local assessors to be the total taxable value of land and additions on the property. | Land | Improvement |
|---|---|---|---|---|
| 2024 | $63 | $1,460 | $1,460 | $0 |
| 2023 | $63 | $1,460 | $1,460 | $0 |
| 2022 | $63 | $1,460 | $1,460 | $0 |
| 2021 | $1,515 | $36,940 | $1,260 | $35,680 |
| 2020 | $1,423 | $36,940 | $1,260 | $35,680 |
| 2019 | $1,422 | $33,610 | $1,170 | $32,440 |
| 2018 | $1,320 | $33,610 | $1,170 | $32,440 |
| 2017 | $1,386 | $30,520 | $1,170 | $29,350 |
| 2016 | $1,194 | $28,870 | $1,170 | $27,700 |
| 2015 | $1,131 | $28,870 | $1,170 | $27,700 |
| 2013 | $1,081 | $28,870 | $1,170 | $27,700 |
Source: Public Records
Map
Nearby Homes
- 246C Rd
- 1447 Mc Dermott Pond Creek Rd
- 3153 McDermott Pond Creek Rd
- 125 Owensville Rd
- 133 Crystal Dr
- 499 Coburn Dr
- 11192 Ohio 104
- 656 Arion Rd
- 358 Warren Ave
- 303 Raymond Ave
- 0 Careys Run
- 0 Shepard Fork Rd
- 448 Houston Hollow Rd
- 11683 Ohio 104
- 669 Dry Run Rd
- 139 Back St
- 525 Martin Cemetery Rd
- 873A Dewey Extension
- 0 Shepherd Fork Rd
- 44 Feurt Hill Rd
- 367 Barker St
- 11 Willow St
- 438 McDermott Rushtown Rd
- 41 Willow St
- 445 Barker St
- 447 Barker St
- 110 Musser St
- 530 McDermott Rushtown Rd
- 530 McDermott Rushtown Rd
- 317 Prior Aly
- 457 Barker St
- 394 McDermott Rushtown
- 378 McDermott Rushtown Rd
- 249 Barker St
- 360 McDermott Rushtown Rd
- 283 Prior Aly
- 80 Musser St
- 126 Willow St
- 229 Barker St
- 117 Willow St