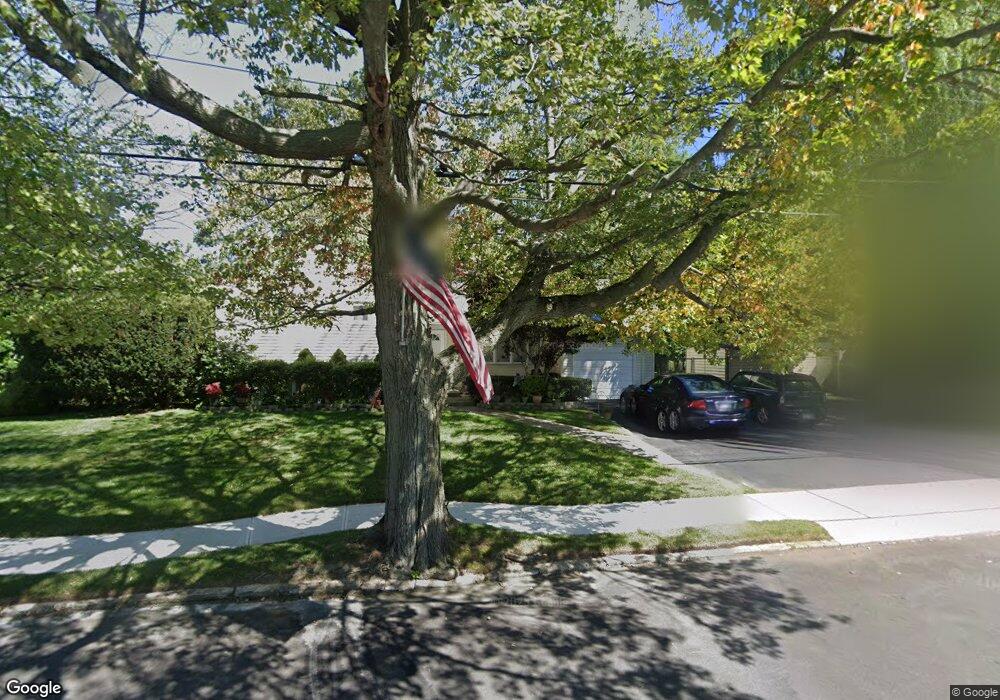
345 Broadway Massapequa Park, NY 11762
Estimated Value: $713,565 - $786,000
--
Bed
2
Baths
1,626
Sq Ft
$461/Sq Ft
Est. Value
About This Home
This home is located at 345 Broadway, Massapequa Park, NY 11762 and is currently estimated at $749,783, approximately $461 per square foot. 345 Broadway is a home located in Nassau County with nearby schools including Massapequa High School - Ames Campus, Berner Middle School, and Massapequa High School.
Ownership History
Date
Name
Owned For
Owner Type
Purchase Details
Closed on
Oct 4, 2023
Sold by
Paliophilos Chrysostomos N and Diakatonis Mary C
Bought by
Paliophilos Nicholas C and Paliophilos Family Trust
Current Estimated Value
Purchase Details
Closed on
Dec 30, 2002
Sold by
Williams James
Bought by
Paliophilos Chrysostomos
Purchase Details
Closed on
Sep 17, 1998
Create a Home Valuation Report for This Property
The Home Valuation Report is an in-depth analysis detailing your home's value as well as a comparison with similar homes in the area
Home Values in the Area
Average Home Value in this Area
Purchase History
| Date | Buyer | Sale Price | Title Company |
|---|---|---|---|
| Paliophilos Nicholas C | -- | Commonwealth Land Ttl Ins Co | |
| Paliophilos Nicholas C | -- | Commonwealth Land Ttl Ins Co | |
| Paliophilos Nicholas C | -- | Commonwealth Land Ttl Ins Co | |
| Paliophilos Chrysostomos | $420,000 | -- | |
| Paliophilos Chrysostomos | $420,000 | -- | |
| -- | -- | -- | |
| -- | -- | -- |
Source: Public Records
Tax History Compared to Growth
Tax History
| Year | Tax Paid | Tax Assessment Tax Assessment Total Assessment is a certain percentage of the fair market value that is determined by local assessors to be the total taxable value of land and additions on the property. | Land | Improvement |
|---|---|---|---|---|
| 2025 | $11,923 | $481 | $201 | $280 |
| 2024 | $3,309 | $502 | $210 | $292 |
| 2023 | $10,951 | $527 | $220 | $307 |
| 2022 | $10,951 | $527 | $220 | $307 |
| 2021 | $9,953 | $532 | $222 | $310 |
| 2020 | $9,485 | $553 | $529 | $24 |
| 2019 | $7,888 | $592 | $530 | $62 |
| 2018 | $7,794 | $632 | $0 | $0 |
| 2017 | $5,296 | $671 | $534 | $137 |
| 2016 | $7,860 | $711 | $509 | $202 |
| 2015 | $2,532 | $750 | $537 | $213 |
| 2014 | $2,532 | $750 | $537 | $213 |
| 2013 | $2,496 | $790 | $566 | $224 |
Source: Public Records
Map
Nearby Homes