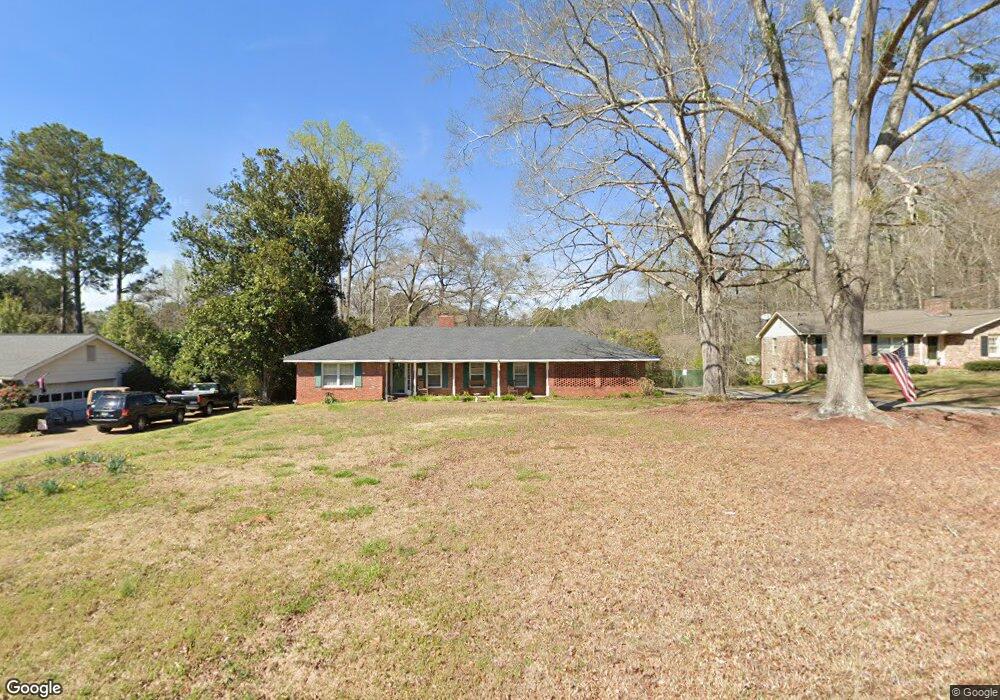
345 Brookridge Dr Lagrange, GA 30241
Estimated Value: $212,000 - $223,000
3
Beds
2
Baths
1,812
Sq Ft
$120/Sq Ft
Est. Value
About This Home
This home is located at 345 Brookridge Dr, Lagrange, GA 30241 and is currently estimated at $217,371, approximately $119 per square foot. 345 Brookridge Dr is a home located in Troup County with nearby schools including Franklin Forest Elementary School, Hollis Hand Elementary School, and Ethel W. Kight Elementary School.
Ownership History
Date
Name
Owned For
Owner Type
Purchase Details
Closed on
Dec 1, 2000
Sold by
Mccart Douglas and Mccart Greta M
Bought by
King Ann and King Stephen C
Current Estimated Value
Purchase Details
Closed on
May 6, 1997
Sold by
John Costa
Bought by
Mccart Douglas and Mccart Greta M
Purchase Details
Closed on
Oct 9, 1990
Sold by
Jane Garrett Carwell
Bought by
John Costa
Purchase Details
Closed on
Aug 1, 1987
Sold by
Carwell
Bought by
Jane Garrett Carwell
Purchase Details
Closed on
Feb 18, 1987
Sold by
Williams W H
Bought by
Carwell
Purchase Details
Closed on
Feb 27, 1978
Sold by
C&S Bank
Bought by
Williams W H
Purchase Details
Closed on
Nov 2, 1977
Bought by
C&S Bank
Purchase Details
Closed on
Jan 1, 1972
Sold by
Yarbrough
Purchase Details
Closed on
Jan 1, 1971
Sold by
Lagrange Investment Co
Bought by
Yarbrough
Purchase Details
Closed on
Sep 1, 1968
Sold by
Roy M Waller
Bought by
Lagrange Investment Co
Create a Home Valuation Report for This Property
The Home Valuation Report is an in-depth analysis detailing your home's value as well as a comparison with similar homes in the area
Purchase History
| Date | Buyer | Sale Price | Title Company |
|---|---|---|---|
| King Ann | $95,000 | -- | |
| Mccart Douglas | $87,100 | -- | |
| John Costa | $82,000 | -- | |
| Jane Garrett Carwell | -- | -- | |
| Carwell | $82,000 | -- | |
| Williams W H | -- | -- | |
| C&S Bank | -- | -- | |
| -- | -- | -- | |
| Yarbrough | -- | -- | |
| Lagrange Investment Co | -- | -- |
Source: Public Records
Tax History
| Year | Tax Paid | Tax Assessment Tax Assessment Total Assessment is a certain percentage of the fair market value that is determined by local assessors to be the total taxable value of land and additions on the property. | Land | Improvement |
|---|---|---|---|---|
| 2025 | $2,224 | $81,540 | $10,000 | $71,540 |
| 2024 | $1,780 | $65,260 | $10,000 | $55,260 |
| 2023 | $1,610 | $59,020 | $10,000 | $49,020 |
| 2022 | $1,585 | $56,780 | $10,000 | $46,780 |
| 2021 | $1,443 | $47,836 | $8,000 | $39,836 |
| 2020 | $1,443 | $47,836 | $8,000 | $39,836 |
| 2019 | $1,338 | $44,368 | $8,000 | $36,368 |
| 2018 | $1,210 | $42,120 | $7,480 | $34,640 |
| 2017 | $1,086 | $38,000 | $5,884 | $32,116 |
| 2016 | $1,086 | $38,000 | $5,884 | $32,116 |
| 2015 | $1,088 | $38,000 | $5,884 | $32,116 |
| 2014 | $1,090 | $38,000 | $5,884 | $32,116 |
| 2013 | -- | $38,000 | $5,884 | $32,116 |
Source: Public Records
Map
Nearby Homes
- 203 Bonaventure Dr
- 224 Rutland Cir
- 706 N Harlem Cir
- 616 S Harlem Cir
- 102 Dogwood Dr
- 87 Youngs Mill Rd
- 131 Foch St
- 210 Hearthstone Dr
- 202 Park Hill Dr
- 204 Cleveland Dr
- 212 Cleveland Dr
- 115 Clara Jean Ct
- 121 de Groat St
- 110 Lenox Cir
- 5 Curran Ave
- 806 New Franklin Rd
- 900 North St
- 114 Briarcliff Rd
- 107 N Barnard Ave
- 110 Russell St
- 0 Brookridge Dr Unit 3058323
- 0 Brookridge Dr Unit 3058321
- 343 Brookridge Dr
- 347 Brookridge Dr
- 471 Camelot Ct
- 341 Brookridge Dr
- 344 Brookridge Dr
- 469 Camelot Ct
- 349 Brookridge Dr
- 349 Brookridge Dr Unit LOT 12
- 346 Brookridge Dr
- 342 Brookridge Dr
- 473 Camelot Ct
- 473 Camelot Ct Unit 26
- 348 Brookridge Dr
- 340 Brookridge Dr
- 361 Hickory Terrace
- 353 Hickory Terrace
- 467 Hickory Terrace
- 465 Hickory Terrace
Your Personal Tour Guide
Ask me questions while you tour the home.