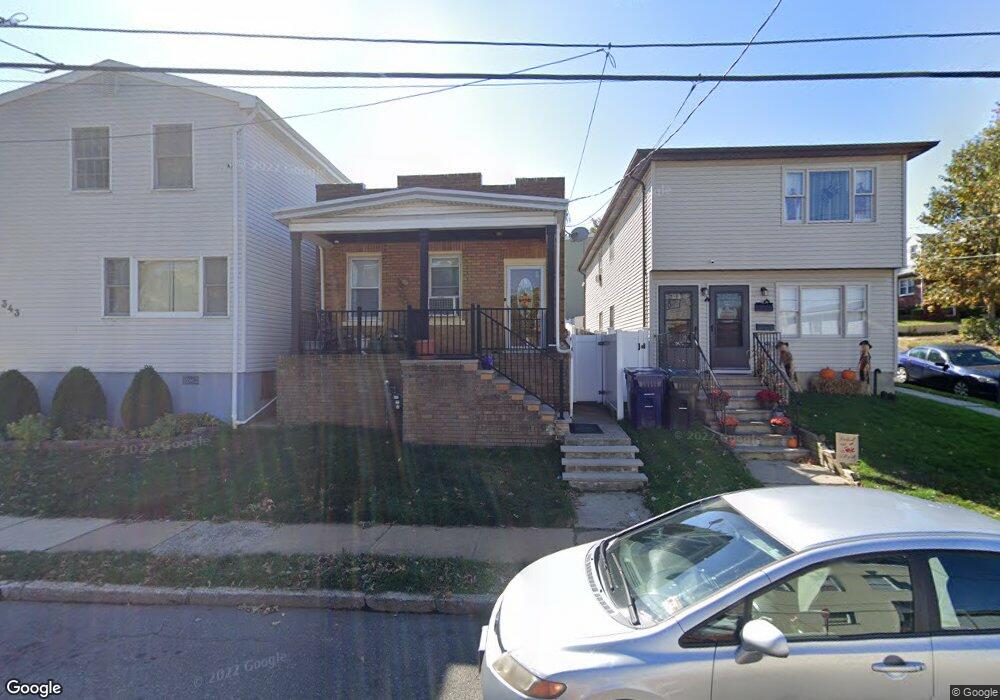
345 Bruck Ave Perth Amboy, NJ 08861
Maurer NeighborhoodEstimated Value: $309,413 - $407,000
--
Bed
--
Bath
895
Sq Ft
$388/Sq Ft
Est. Value
About This Home
This home is located at 345 Bruck Ave, Perth Amboy, NJ 08861 and is currently estimated at $346,853, approximately $387 per square foot. 345 Bruck Ave is a home located in Middlesex County with nearby schools including Perth Amboy High School, Academy for Urban Leadership Charter School, and Assumption Catholic School.
Ownership History
Date
Name
Owned For
Owner Type
Purchase Details
Closed on
Aug 1, 2008
Sold by
Diaz Jesus M and Diaz Migdalia
Bought by
Diaz Nelson
Current Estimated Value
Home Financials for this Owner
Home Financials are based on the most recent Mortgage that was taken out on this home.
Original Mortgage
$188,000
Interest Rate
6.58%
Mortgage Type
New Conventional
Purchase Details
Closed on
Apr 26, 2008
Sold by
Diaz Jesus M and Diaz Migdalia
Bought by
Diaz Jesus M and Diaz Migdalia
Create a Home Valuation Report for This Property
The Home Valuation Report is an in-depth analysis detailing your home's value as well as a comparison with similar homes in the area
Home Values in the Area
Average Home Value in this Area
Purchase History
| Date | Buyer | Sale Price | Title Company |
|---|---|---|---|
| Diaz Nelson | -- | None Available | |
| Diaz Jesus M | -- | None Available |
Source: Public Records
Mortgage History
| Date | Status | Borrower | Loan Amount |
|---|---|---|---|
| Closed | Diaz Nelson | $188,000 |
Source: Public Records
Tax History Compared to Growth
Tax History
| Year | Tax Paid | Tax Assessment Tax Assessment Total Assessment is a certain percentage of the fair market value that is determined by local assessors to be the total taxable value of land and additions on the property. | Land | Improvement |
|---|---|---|---|---|
| 2025 | $5,238 | $173,600 | $86,400 | $87,200 |
| 2024 | $5,227 | $173,600 | $86,400 | $87,200 |
| 2023 | $5,227 | $173,600 | $86,400 | $87,200 |
| 2022 | $5,165 | $173,600 | $86,400 | $87,200 |
| 2021 | $5,172 | $173,600 | $86,400 | $87,200 |
| 2020 | $5,170 | $173,600 | $86,400 | $87,200 |
| 2019 | $5,189 | $173,600 | $86,400 | $87,200 |
| 2018 | $5,144 | $173,600 | $86,400 | $87,200 |
| 2017 | $5,133 | $173,600 | $86,400 | $87,200 |
| 2016 | $5,000 | $173,600 | $86,400 | $87,200 |
| 2015 | $5,034 | $173,600 | $86,400 | $87,200 |
| 2014 | $5,066 | $173,600 | $86,400 | $87,200 |
Source: Public Records
Map
Nearby Homes