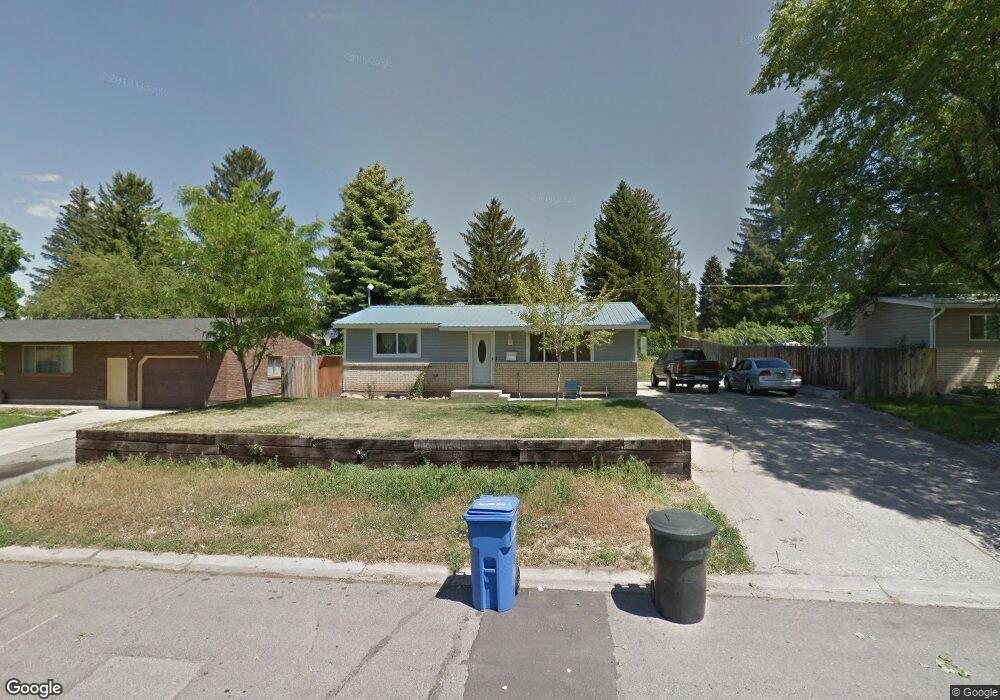
345 E 120 S Smithfield, UT 84335
Estimated Value: $359,000 - $391,000
4
Beds
2
Baths
1,824
Sq Ft
$208/Sq Ft
Est. Value
About This Home
This home is located at 345 E 120 S, Smithfield, UT 84335 and is currently estimated at $379,829, approximately $208 per square foot. 345 E 120 S is a home located in Cache County with nearby schools including Sunrise School, Cedar Ridge School, and North Cache Middle School.
Ownership History
Date
Name
Owned For
Owner Type
Purchase Details
Closed on
Nov 18, 2021
Sold by
Blue Arrow Llc
Bought by
May David and Maughan Camry
Current Estimated Value
Home Financials for this Owner
Home Financials are based on the most recent Mortgage that was taken out on this home.
Original Mortgage
$352,100
Outstanding Balance
$321,280
Interest Rate
2.99%
Mortgage Type
New Conventional
Estimated Equity
$58,549
Purchase Details
Closed on
Sep 9, 2021
Sold by
Blue Arrow Llc
Bought by
Stewart Title Of Utah Inc and Think Big Investments Llc
Home Financials for this Owner
Home Financials are based on the most recent Mortgage that was taken out on this home.
Original Mortgage
$24,500
Interest Rate
2.88%
Create a Home Valuation Report for This Property
The Home Valuation Report is an in-depth analysis detailing your home's value as well as a comparison with similar homes in the area
Home Values in the Area
Average Home Value in this Area
Purchase History
| Date | Buyer | Sale Price | Title Company |
|---|---|---|---|
| May David | -- | Cache Title | |
| Stewart Title Of Utah Inc | -- | Accommodation | |
| Blue Arrow Llc | -- | Stewart Title Ins Agcy Of Ut |
Source: Public Records
Mortgage History
| Date | Status | Borrower | Loan Amount |
|---|---|---|---|
| Open | May David | $352,100 | |
| Previous Owner | Blue Arrow Llc | $24,500 | |
| Previous Owner | Blue Arrow Llc | $216,000 | |
| Previous Owner | Stewart Title Of Utah Inc | $24,500 |
Source: Public Records
Tax History
| Year | Tax Paid | Tax Assessment Tax Assessment Total Assessment is a certain percentage of the fair market value that is determined by local assessors to be the total taxable value of land and additions on the property. | Land | Improvement |
|---|---|---|---|---|
| 2025 | $1,392 | $186,280 | $0 | $0 |
| 2024 | $160 | $200,980 | $0 | $0 |
| 2023 | $1,671 | $198,440 | $0 | $0 |
| 2022 | $1,698 | $198,440 | $0 | $0 |
| 2021 | $1,331 | $237,520 | $70,000 | $167,520 |
| 2020 | $1,259 | $209,600 | $70,000 | $139,600 |
| 2019 | $1,044 | $165,794 | $45,000 | $120,794 |
| 2018 | $960 | $147,368 | $45,000 | $102,368 |
| 2017 | $895 | $75,020 | $0 | $0 |
| 2016 | $910 | $75,020 | $0 | $0 |
| 2015 | $914 | $75,020 | $0 | $0 |
| 2014 | $852 | $71,340 | $0 | $0 |
| 2013 | -- | $71,340 | $0 | $0 |
Source: Public Records
Map
Nearby Homes
Your Personal Tour Guide
Ask me questions while you tour the home.